Anatomy of an OTT Traffic Surge: The Tyson-Paul Fight on Netflix

Summary
On November 15, Netflix made another venture into the business of live event streaming with the highly-anticipated, if somewhat absurd, boxing match between the 58-year-old former heavyweight champion Mike Tyson and social media star Jake Paul. The five hour broadcast also included competitive undercard fights including a bloody rematch between Katie Taylor and Amanda Serrano. Doug Madory looks at how Netflix delivered the fight using Kentik’s OTT Service Tracking.
On Friday night, Netflix streamed its much-hyped boxing match between social media star Jake Paul and retired boxing great “Iron” Mike Tyson. The problematic delivery of the fight became almost as big a story as the match itself — which Paul won by decision after 10 rounds.
Many viewers (including myself) endured buffering and disconnections to watch the bout, leading many to conclude that Netflix’s streaming architecture was not ready for such a blockbuster event. In an Instagram post on Saturday, Netflix conceded that the fight “had our buffering systems on the ropes.”
Let’s analyze this traffic surge using Kentik’s OTT Service Tracking…
OTT Service Tracking
Kentik’s OTT Service Tracking (part of Kentik Service Provider Analytics) combines DNS queries with NetFlow to allow a user to understand exactly how OTT services are being delivered — an invaluable capability when trying to determine what is responsible for the latest traffic surge. Whether it is a Call of Duty update or the first-ever exclusively live-streamed NFL playoff game, these OTT traffic events can put a lot of load on a network and understanding them is necessary to keep a network operating at an optimal level.
The capability is more than simple NetFlow analysis. Knowing the source and destination IPs of the NetFlow of a traffic surge isn’t enough to decompose a networking incident into the specific OTT services, ports, and CDNs involved. DNS query data is necessary to associate NetFlow traffic statistics with specific OTT services in order to answer questions such as, “What specific OTT service is causing my peering link with a certain CDN to become saturated?”
Kentik True Origin is the engine that powers OTT Service Tracking workflow. True Origin detects and analyzes the DNA of over 1000 categorized OTT services delivered by 79 CDNs in real time, all without the need to deploy DPI (deep packet inspection) appliances behind every port at the edge of the network.
Netflix’s Punch Out
So, how big was the event? Do we actually know? On Saturday, Netflix reported an audience of 60 million households worldwide. While we only have a slice of the overall traffic, we can use it to gauge the increase in viewership.
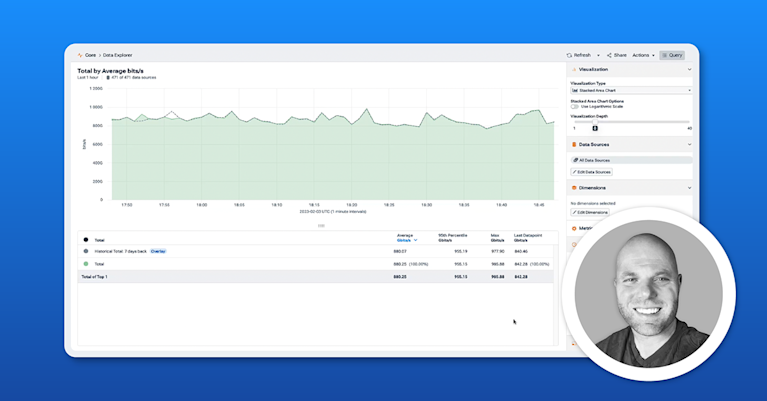
Kentik customers using OTT Service Tracking observed the following statistics, illustrated below. When measured in bits/sec, traffic surged to almost three times the normal peak (unique destination IPs were up 2x). A figure that has been echoed in my private discussions with multiple providers. Unlike every previous episode of Anatomy of an OTT Traffic Surge, here the content was delivered from a single source CDN: Netflix itself.
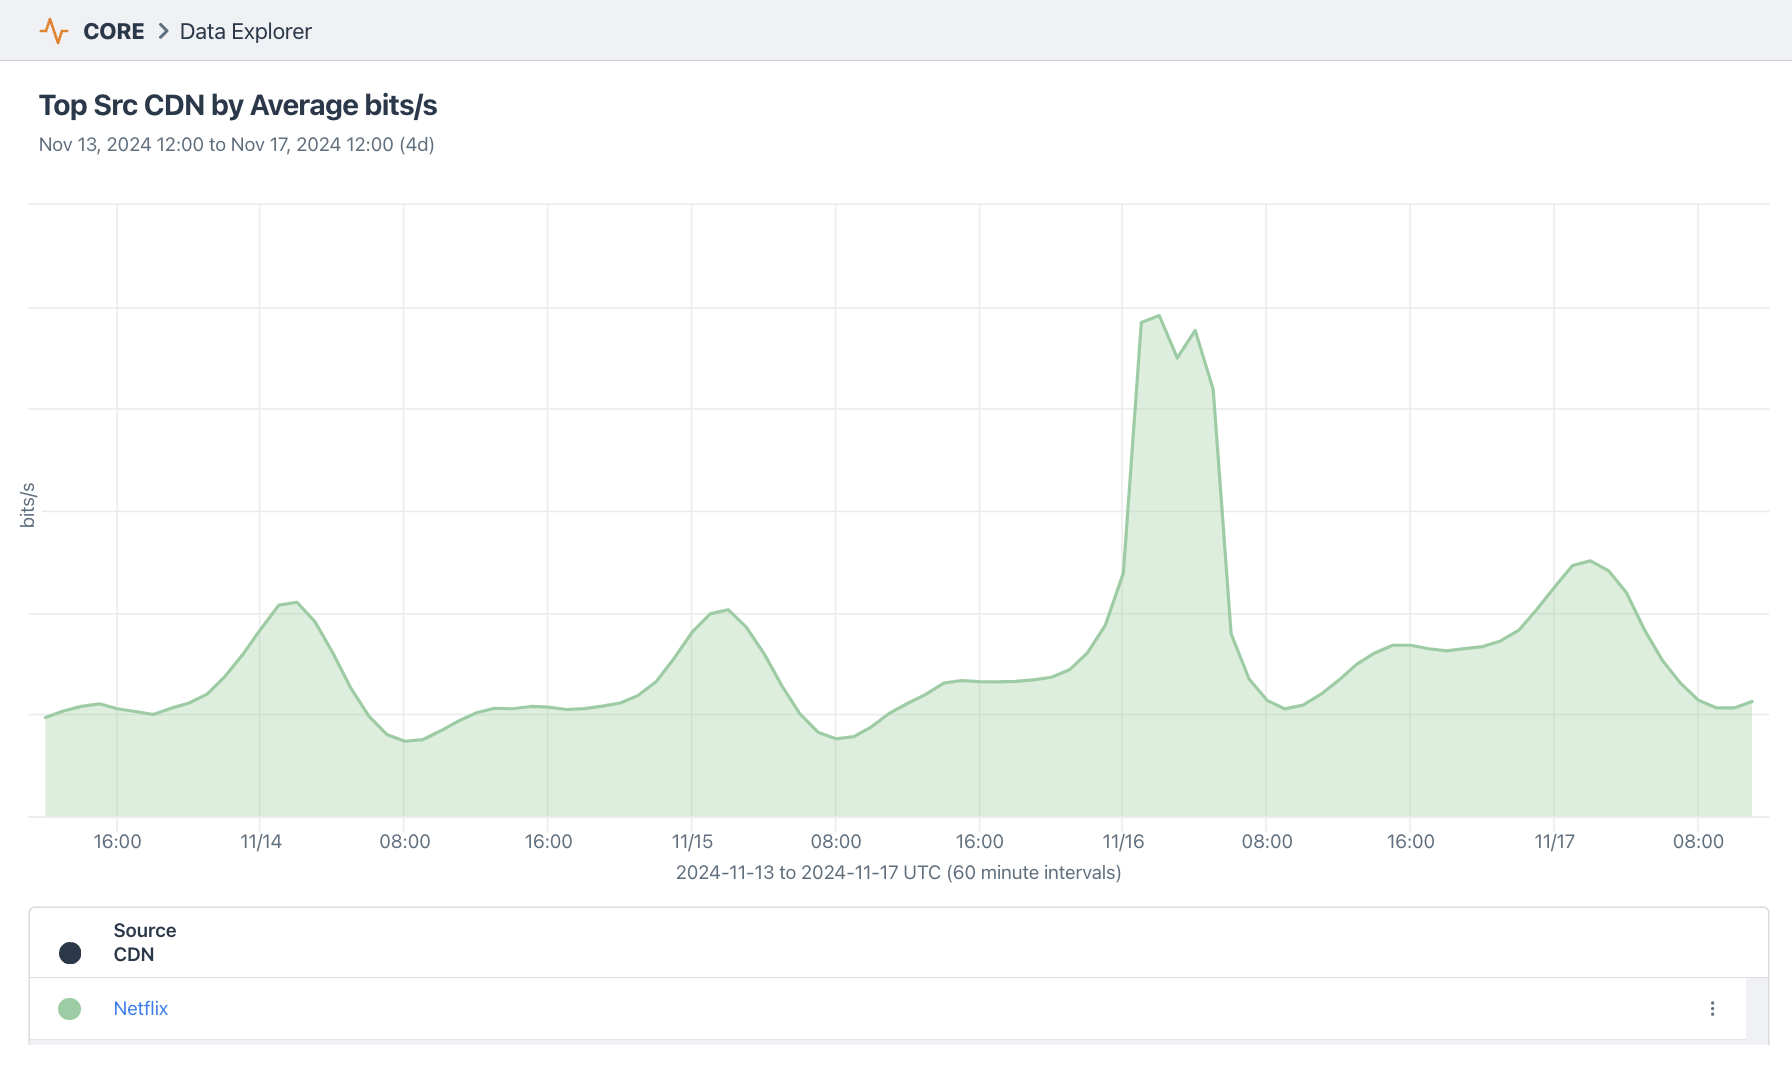
Netflix operates its own fleet of cache servers as part of its Open Connect content delivery network. These Open Connect appliances show up in Kentik’s OTT Service Tracking as embedded caches, which is the primary way programming is delivered to Netflix viewers. It was no different for the Tyson fight on Friday.
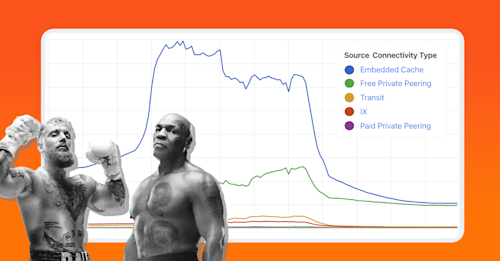
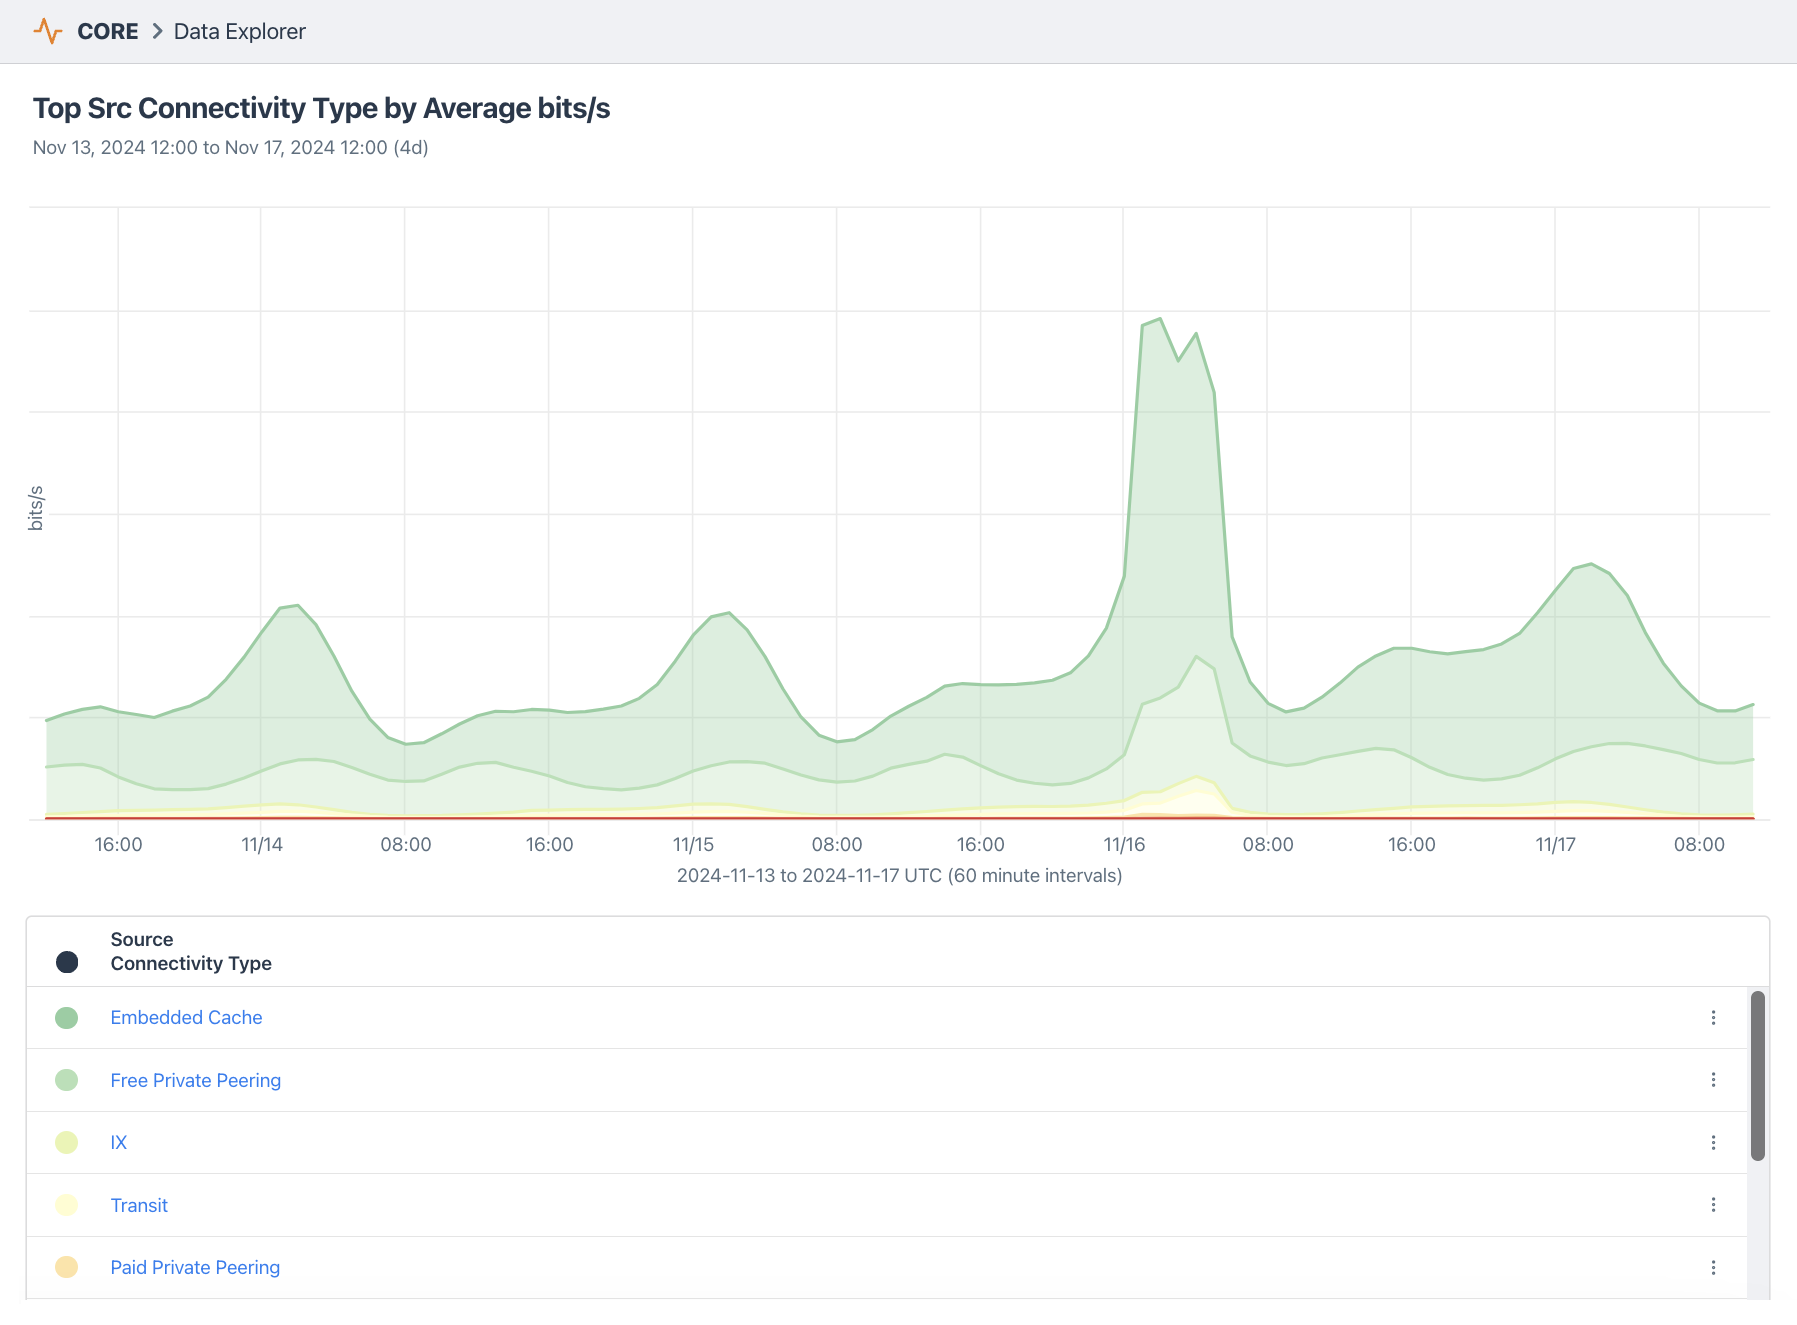
When broken down by Connectivity Type (below), Kentik customers received the traffic from a variety of sources including Embedded Cache (69.6%), Private Peering (23.9%), Transit (3.3%), and Public Peering (IXP) (3.0%).
So, what caused the buffering issues that many experienced on Friday night? Streaming media expert Dan Rayburn posted a helpful list of myths and conjectures that some vendors pushed to explain the challenges that Netflix faced.
Bottom line: diagnosing any delivery failures is complicated. People watching movies on Netflix seemed to be fine while those watching the fight experienced buffering. We’d need to isolate each type of Netflix traffic to fully investigate the live streaming problems.
John van Oppen of Ziply Fiber also wrote on LinkedIn from an engineer’s perspective about what might have caused the buffering problems — while making clear he received “near zero reports of issues” from Ziply’s customers. John raised a couple of points worth considering.
The first was that because the content was delivered from a single CDN, “fewer paths available for traffic if links filled.” As mentioned earlier, this is the first Anatomy of an OTT Surge post that featured an OTT event delivered by a single CDN.
He added that Ziply saw almost 2.5 times (not too far from our estimate) normal Netflix traffic levels — a manageable amount due to the extra capacity they built into their peering connections established at “redundant pairs of locations.” Alternatively, running transit and peering “hot” to save costs could lead to problems when there is a flood of traffic.
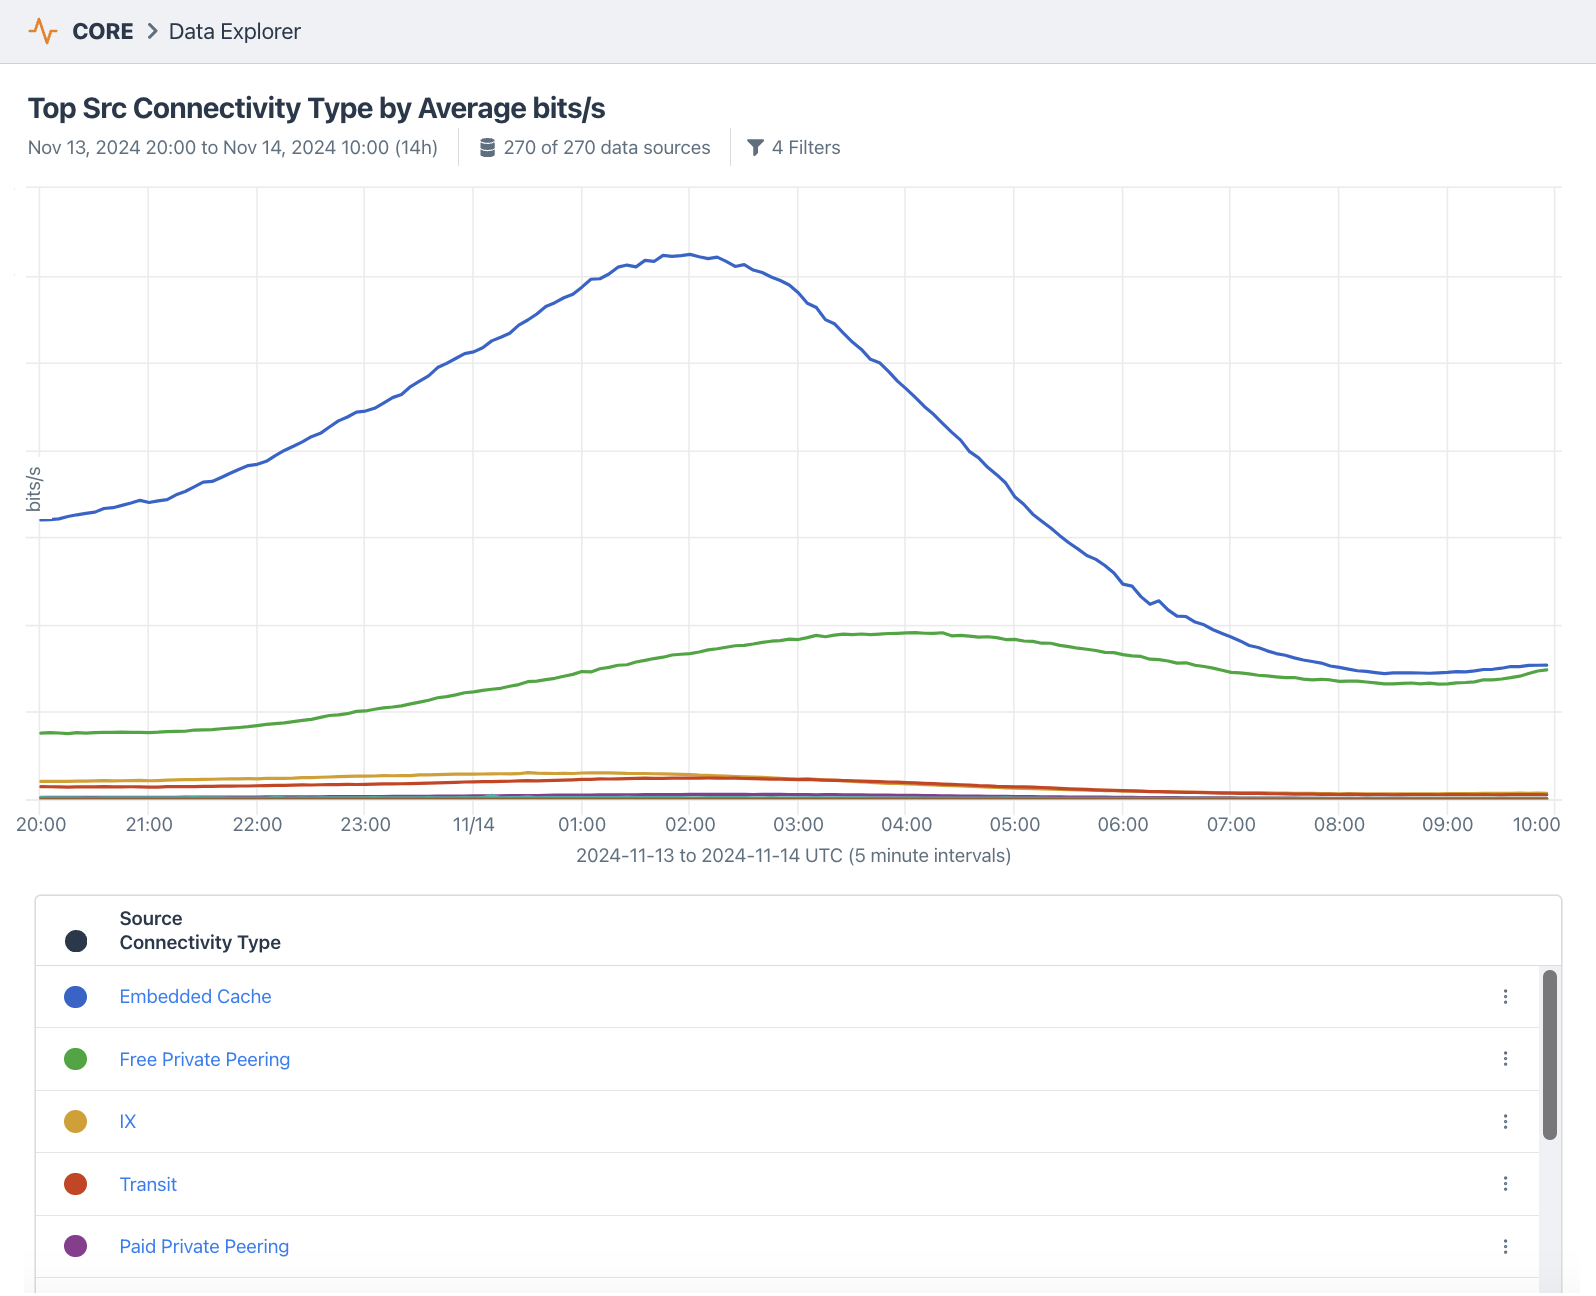
Let’s take one last look at the data. If we zoom into a normal period of peak Netflix traffic (pictured below), we can see the smooth rise and fall of content being delivered, primarily by Netflix Open Connect appliances (i.e., Embedded Cache).
Contrast the view above with the one below which corresponds to the delivery of Netflix traffic across all of our OTT customers around the time of the fight. The key aspects to me are the steep rise of Embedded Cache traffic (blue) just before 01:00 UTC on Nov 16 (which was 8pm ET) as millions of people start watching the program.
At a certain point, the graph becomes jagged suggesting traffic isn’t being delivered as expected. Private Peering (green) also becomes jagged and Transit (yellow) begins to rise to partially supply the content not being satisfied by caching or peering.
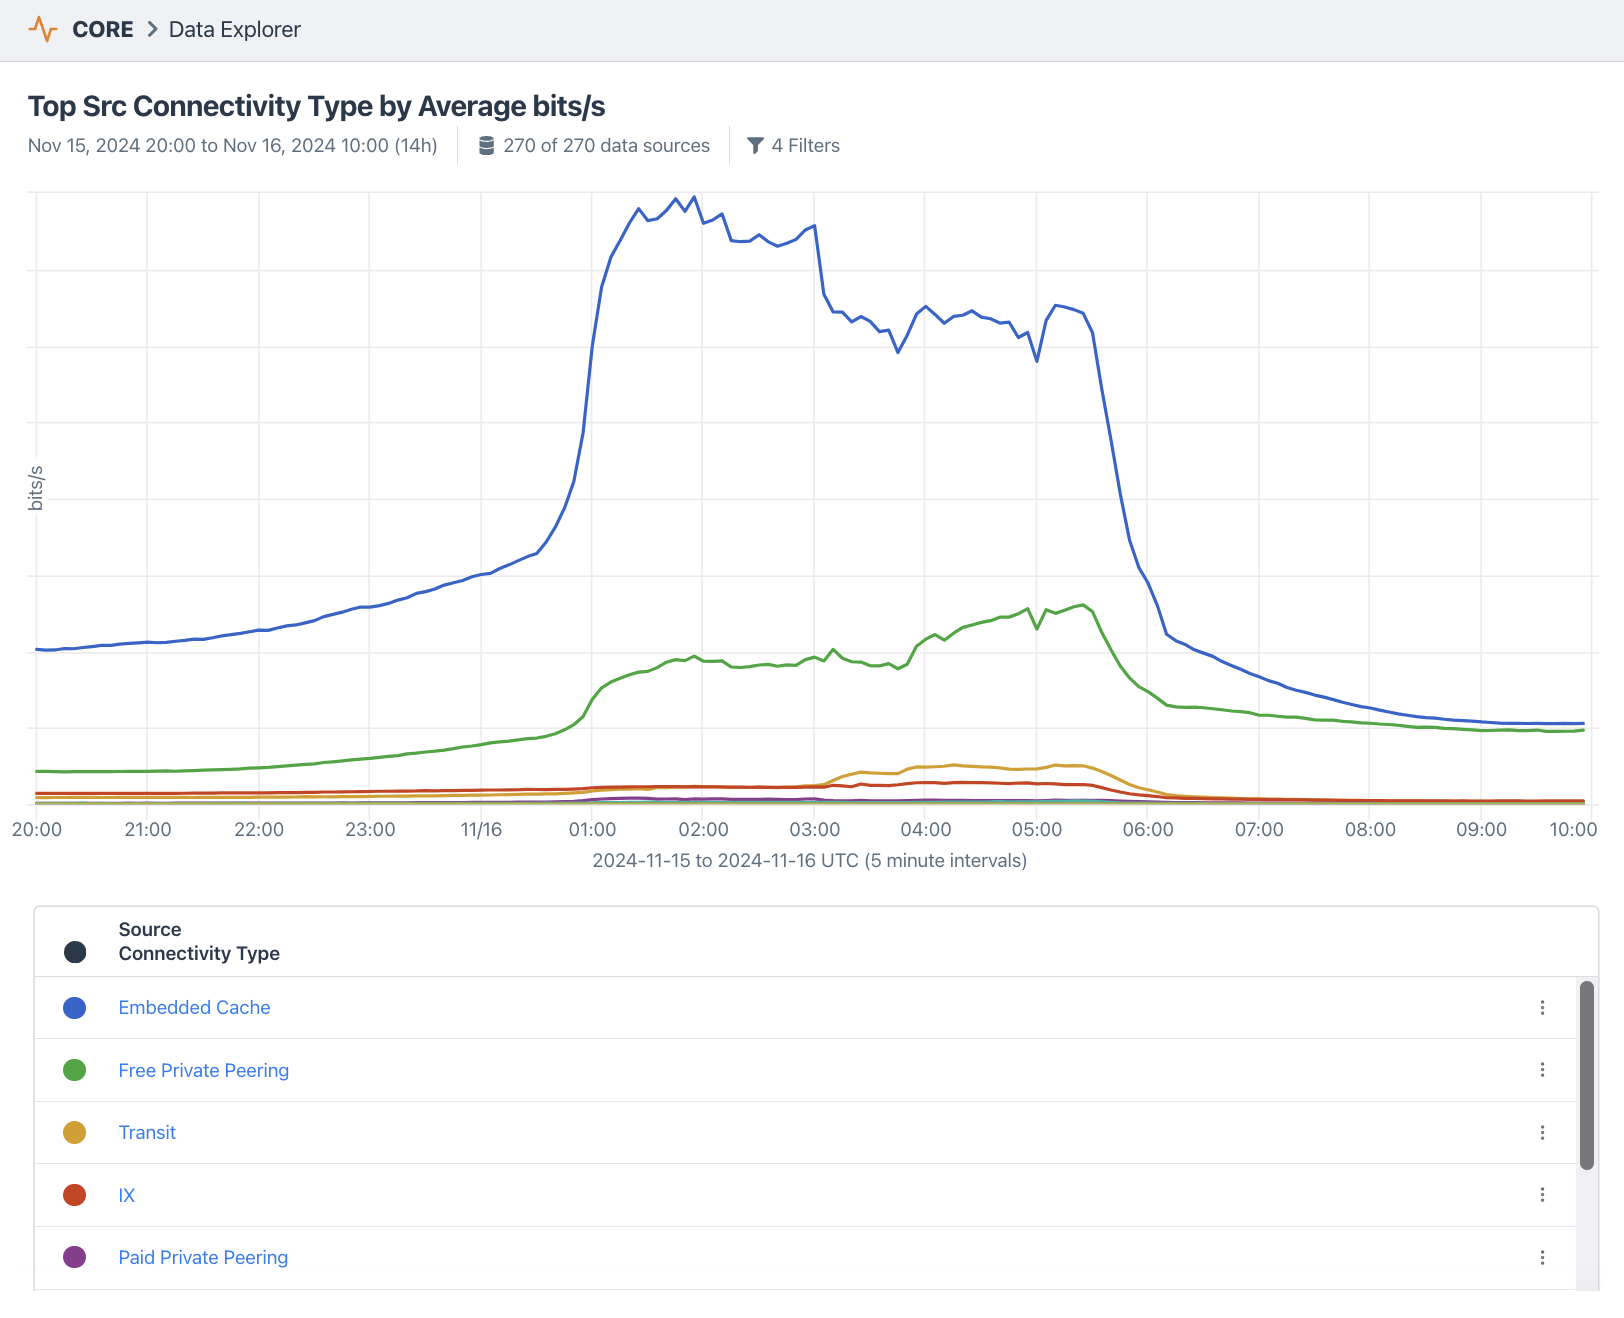
To really identify the culprit, we’d need to use the OTT Service Tracking to look for saturated links with Netflix — not something I can do with aggregate data here, unfortunately.
Conclusion
Previously, my colleague Greg Villain described enhancements to our OTT Service Tracking workflow which allows providers to plan and execute what matters to their subscribers, including:
- Maintaining competitive costs
- Anticipating and fixing subscriber OTT service performance issues
- Delivering sufficient inbound capacity to ensure resilience
Major traffic events like Netflix’s Tyson-Paul fight can have impacts in all three areas. OTT Service Tracking is the key to understanding and responding when they occur. Learn more about the application of Kentik for subscriber intelligence.
Ready to improve over-the-top service tracking for your own networks? Get a personalized demo.
