Summary
API monitoring is the process of keeping tabs on the performance of your REST APIs. Learn how Kentik’s API monitoring tools let you identify bottlenecks, spot performance drops, and maintain API availability. Learn more in this API monitoring how-to tutorial.
APIs are complex, particularly if you run lots of microservices. If you want to deliver the best possible service, you have to monitor them. Monitoring your API lets you identify bottlenecks, spot performance drops, and maintain availability, all essential to ensuring a quality experience for your end users.
Let’s take a look at how to use Kentik as a comprehensive API monitoring solution. We’ll go over how to glean metrics and enable reporting and alerts, as well as what you need to look for in a monitoring tool in general.
What is API monitoring?
API monitoring is simply the process of keeping tabs on the performance of your APIs. You can monitor their status and collect metrics like response time and resource consumption, just to name a few.
Your API monitoring system should be running all the time, continually logging information and letting you spot any peaks or troughs in your service delivery. These details can help you identify problems and figure out what needs to improve. For example, understanding the relative performance of your API’s endpoints and how they interact with one another lets you improve overall user experience.
Why do you need API monitoring?
Monitoring can improve your API in several areas:
- Performance. APIs need to respond quickly to ensure that users aren’t kept waiting. That’s all the more important for interconnected services, as one slow service can affect many others. Monitoring alerts you to performance drops, so you can fix the troublesome service and see what else it’s impacting.
- Availability and reliability. If a service becomes unavailable, you need to know right away. You want the details, such as how long it was down for, what was the impact on other services, and what happened prior to it dropping.
- Internal bottlenecks. In complex, interdependent systems, any minor issue can disproportionately affect the wider system. API monitoring lets you pinpoint the source of issues and quickly diagnose and fix problems.
- End user experience. When your API runs smoothly, your users have a better experience. You can monitor your system to ensure the metrics that matter to your users are within expected levels. A system that detects drops in performance before they become serious can give you a headstart. You might even be able to fix problems before your users notice
- Target delivery. Metrics are critical for business relationships — if you’re contractually obligated to provide a certain level of performance with your API, you probably have a service level agreement (SLA) that defines those requirements. Service level indicators (SLIs) are the metrics used in these agreements.
How to Monitor APIs with Kentik
Let’s take a look at how Kentik addresses monitoring for APIs.
Setting up your data source
Of course, you need a data source before getting properly started with monitoring. You can use an existing API or create a quick boilerplate system for testing purposes. Kentik also allows you to switch to its fully functional demo mode using pre-existing data.
You can create a simple API to test with on a Linux system. Ensure Docker is installed with the following:
docker –versionIf Docker isn’t installed, install it via:
sudo apt install docker.ioYou can create a Docker image yourself or download one to use as a starting point.
To expose Docker’s API to the world, use:
sudo dockerd -H unix:///var/run/docker.sock -H tcp://0.0.0.0:2375Connect to your server at its IP address over port 2375.
Setting up Kentik
Now let’s set up Kentik as an API monitoring solution.
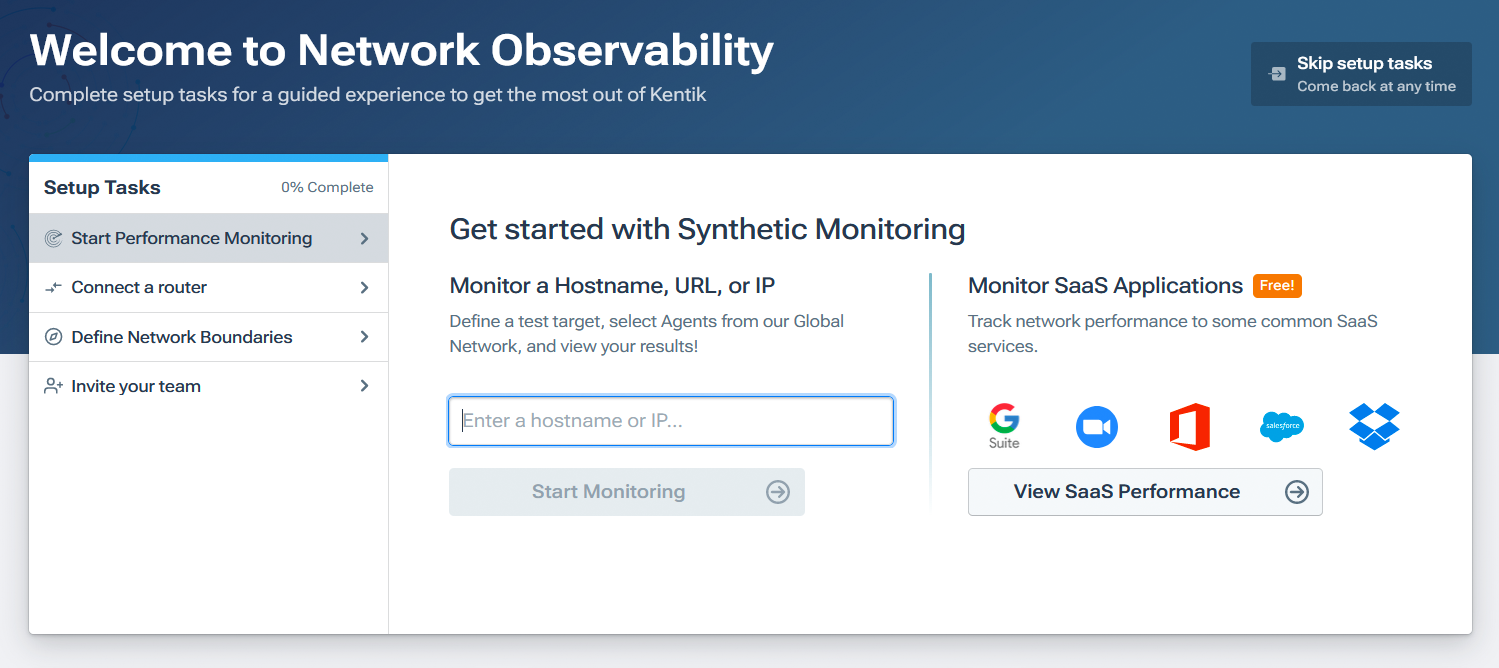
Sign up with Kentik (you can follow that link or fill out the “Try Kentik” form at left) and log in. Follow the prompts to let Kentik guide you to the right features to set up your monitoring tasks.
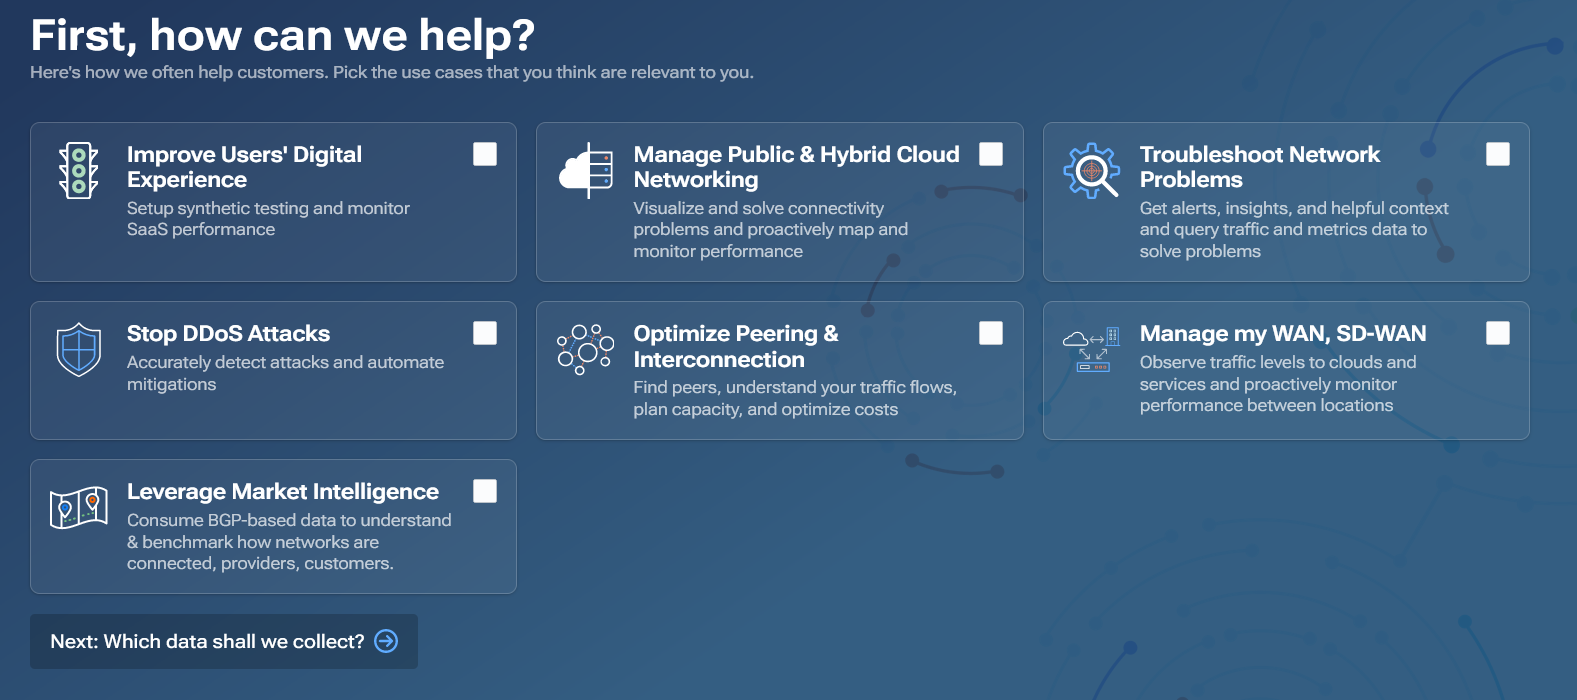
You can add your Linux server as a data source here or whatever other data sources you want to pipe in.
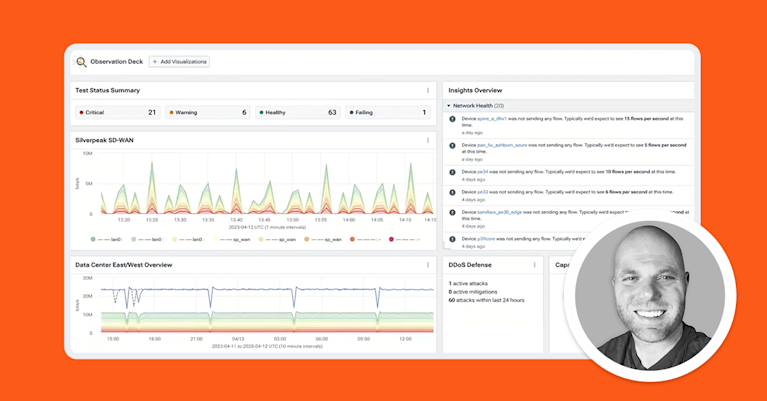
Proceed to Kentik’s dashboards for an overview of the information you’re capturing. From here, you can see everything you need to know about your API in one place. These dashboards are heavily customizable — you can create a blank one of your own or use one of many preset options. You access them through the library in the Kentik portal.
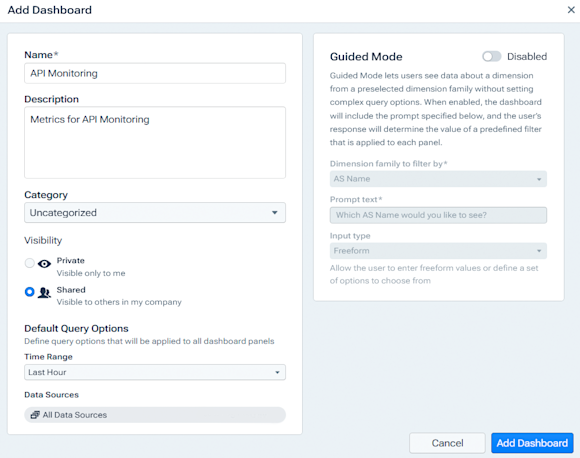
You can choose various display options for a dashboard according to what best serves your use case. Decide how often your data sources are updated and what related info is displayed. You can keep your dashboards private, share them with your team, or quickly create PDF reports from their data.
Of course, your dashboards are an excellent place to monitor the status of your API. For example, if your dashboard indicates a broken endpoint, you can go back to Docker and fix the endpoint, and the dashboard will update its status appropriately.
As mentioned earlier, you can configure how often Kentik gets new info, so ensure you have a low enough value to pick up changes promptly. Too few updates, and you won’t spot outages quickly enough. Too many, and your resource consumption will be higher. Hourly updates are acceptable in many cases, but you can keep a closer eye on critical services where needed.
Running synthetic tests on your API
Synthetic tests let you run continual tests on your APIs. They’re enabled via agents to connect your infrastructure to Kentik’s monitoring tools.
To run synthetic tests on your own APIs, install Kentik’s ksynth agent. You can do that in Bash on Debian-based packages via:
apt-get install ksynth-agentOr on RPM-based systems:
yum install ksynth-agentOnce ksynth is installed, start the agent via:
systemctl start ksynth-agentTo set up a ksynth agent for Docker, create a folder for it and then run:
docker run -it --rm -v /path/to/local/directory:/var/lib/ksynth-agent kentik/ksynth-agent:latest ksynth-agent -uYou also need to register and activate the agent. Consult Kentik’s documentation if you need help with that — the process varies by system.
To allow ksynth agents to communicate with Kentik, you need to let them through your firewall. That means whitelisting the following:
- IP addresses
208.76.14.0/242620:129::/44
- Domains
flow.kentik.comapi.kentik.com
To create a test, navigate to a Kentik dashboard and click Add next to Synthetic Test View. In the panel that appears, select your test type, display type, and so on, before choosing the data source for your test.
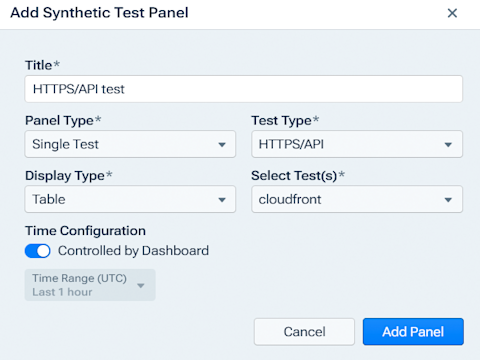
This example selects an HTTPS/API test using CloudFront data and displays it as a table. Here’s how that looks on the dashboard:

This shows metrics for various AWS addresses. From this panel, you can see the certificate expiry and the status code. These are both easy metrics to monitor and helpful for generating alerts when you need to fix an outage or if you have an upcoming certificate expiry.
The panel also shows performance metrics, such as domain lookup time, connection time, response time, and HTTP latency. You can set thresholds to determine what metrics are acceptable and when you should receive an alert.
Setting useful metrics in a Kentik dashboard
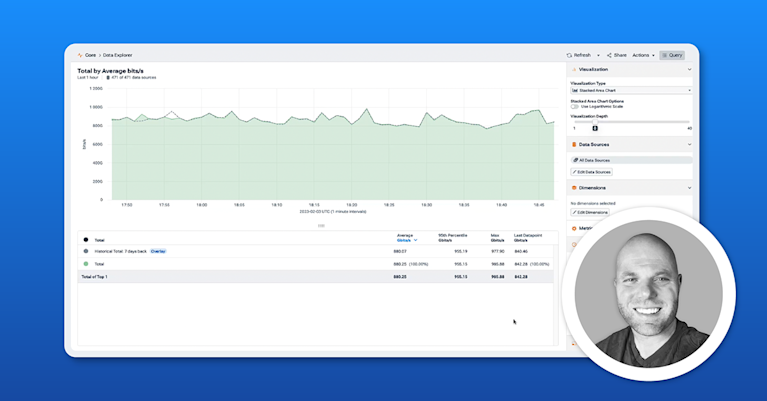
Kentik can help you monitor a wide variety of metrics. To add a new metric, click Add next to Data Explorer View. On the Add Data Panel window that appears, select from various visualizations, data sources, and metrics.
You can also customize the metrics, add filters, and change the timescale over which they’re collected. Let’s go through some of them:
- Latency. A key metric that tells you how long users have to wait before getting a response from the server. Select server latency from the Metrics section of the Add Data Panel window.
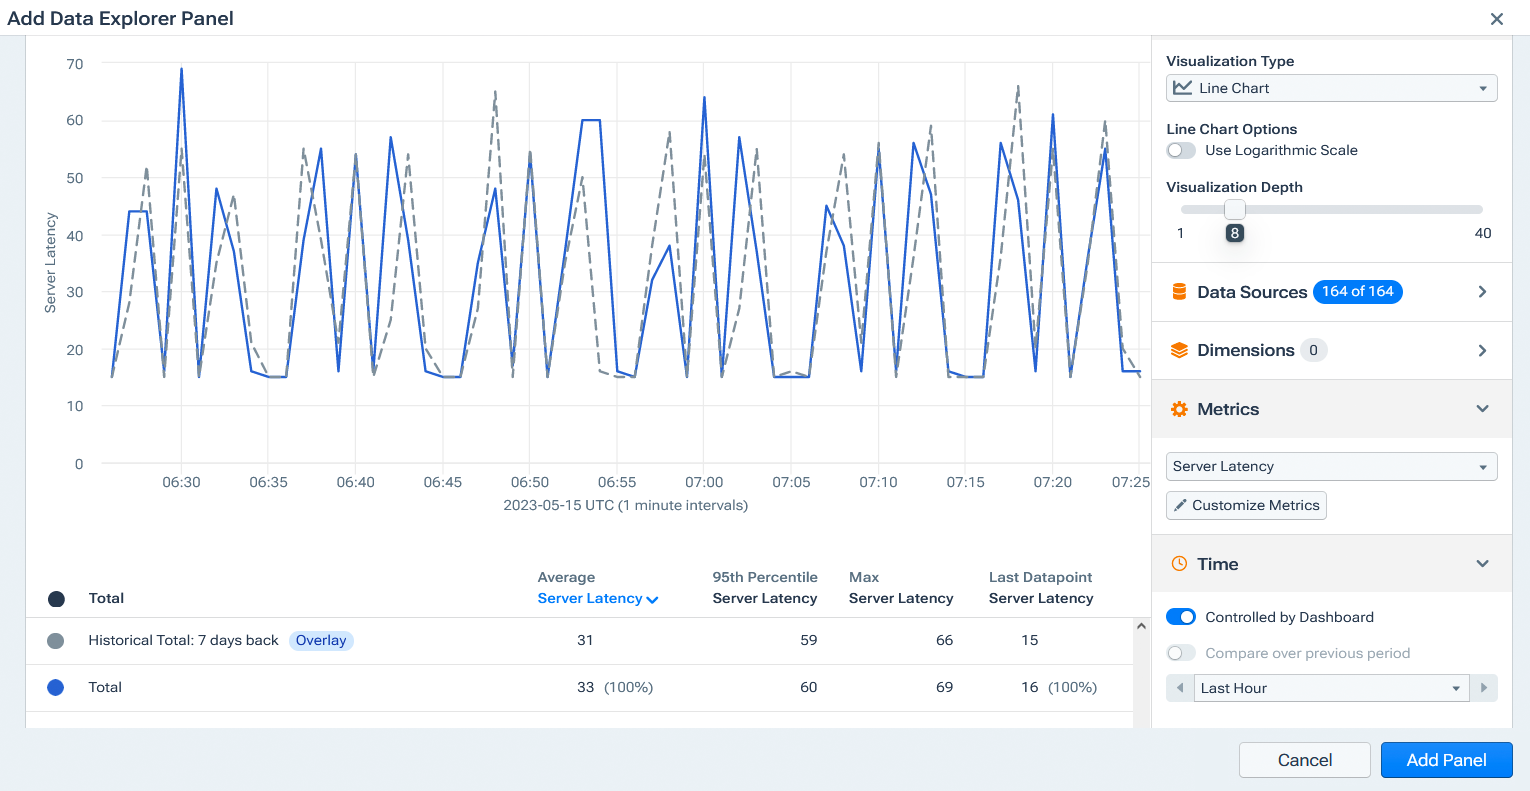
- Throughput. The throughput of your services shows how much work your server is doing, i.e., the total rate of your services in bits per second.
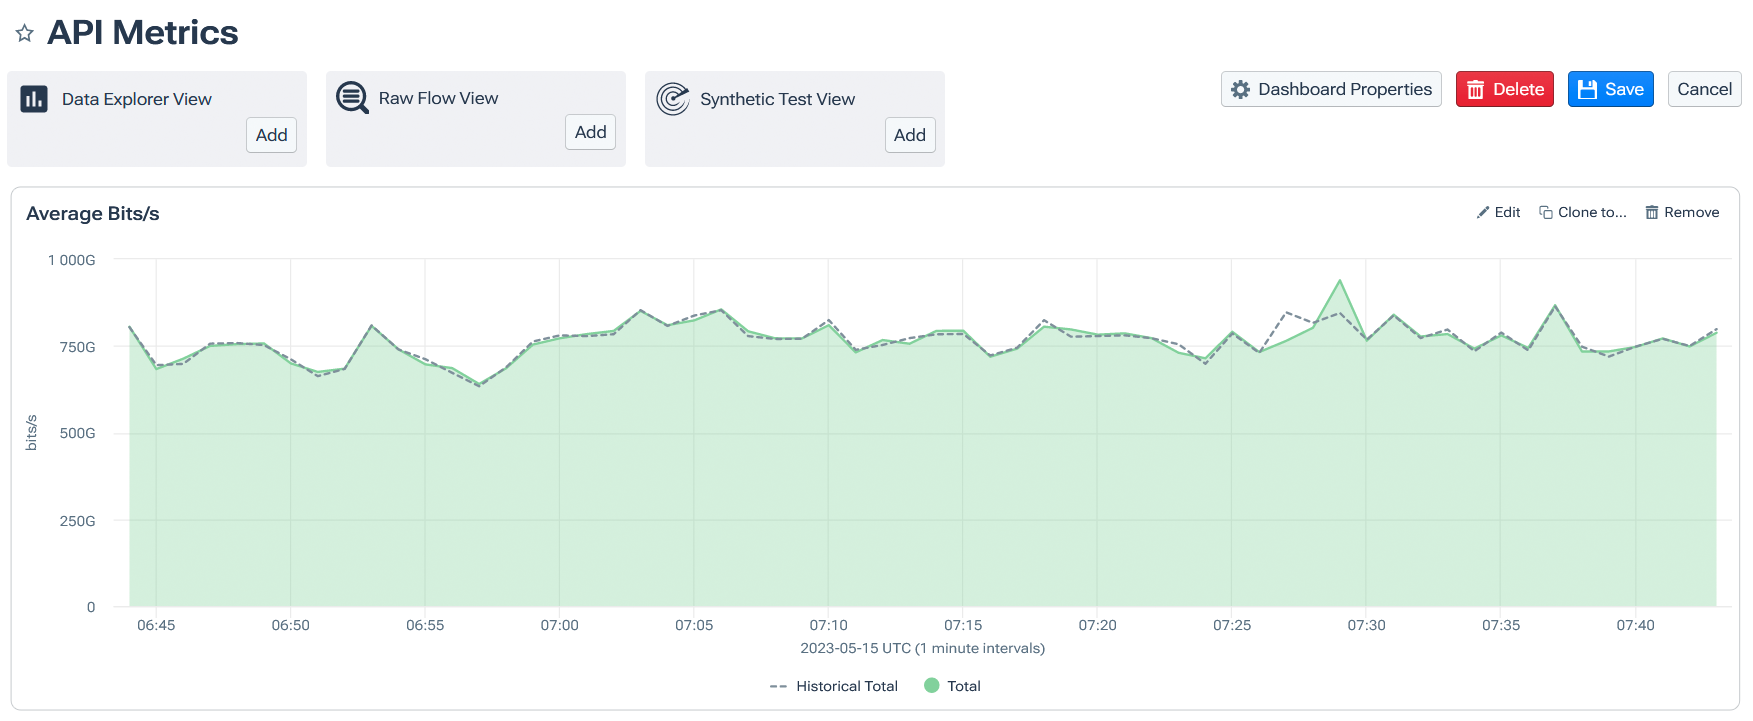
- Jitter. A measure of how latency varies over time. Jitter can cause packet loss if packets are received out of order, or higher latency if networks adjust to compensate for the varying speed.
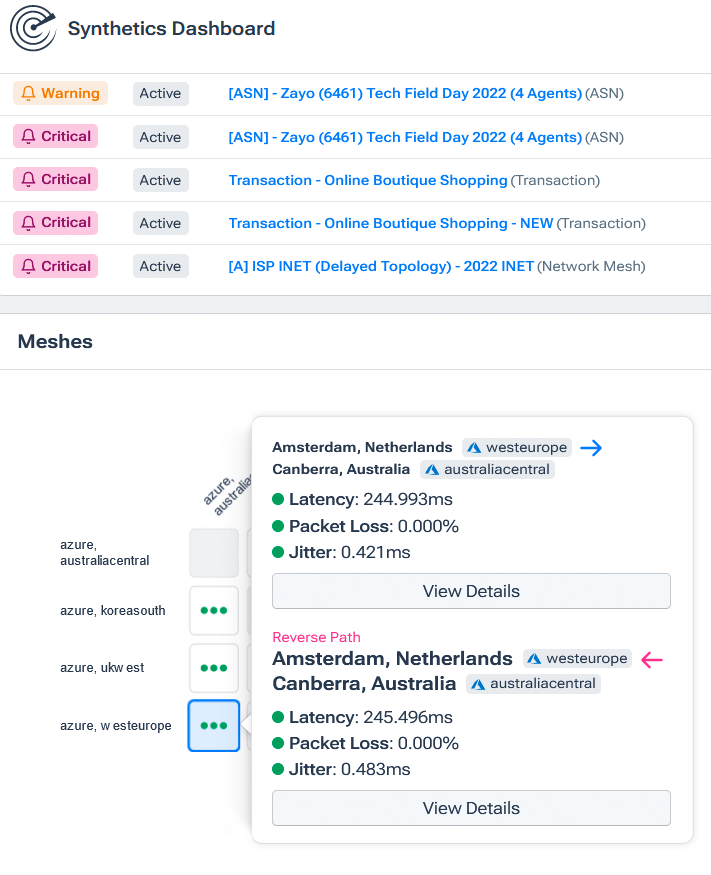
Other metrics you could add to your dashboard include the following:
- Response time. How long a service takes to respond following a call. The lower, the better!
- Error rate. Divide the failed calls by the total calls made to calculate the percentage of calls that succeeded. Any errors are worth investigating, but calls with high error rates are clearly more urgent.
- Uptime. Track how long service outages last and divide this by the time you’ve been monitoring to calculate your API’s uptime. This can be key to delivering on your SLAs.
Alerts and reporting for API monitoring
Now that you’re tracking various metrics, what can you do with that information? Let’s set up alerts so Kentik can inform you about any problems it detects.
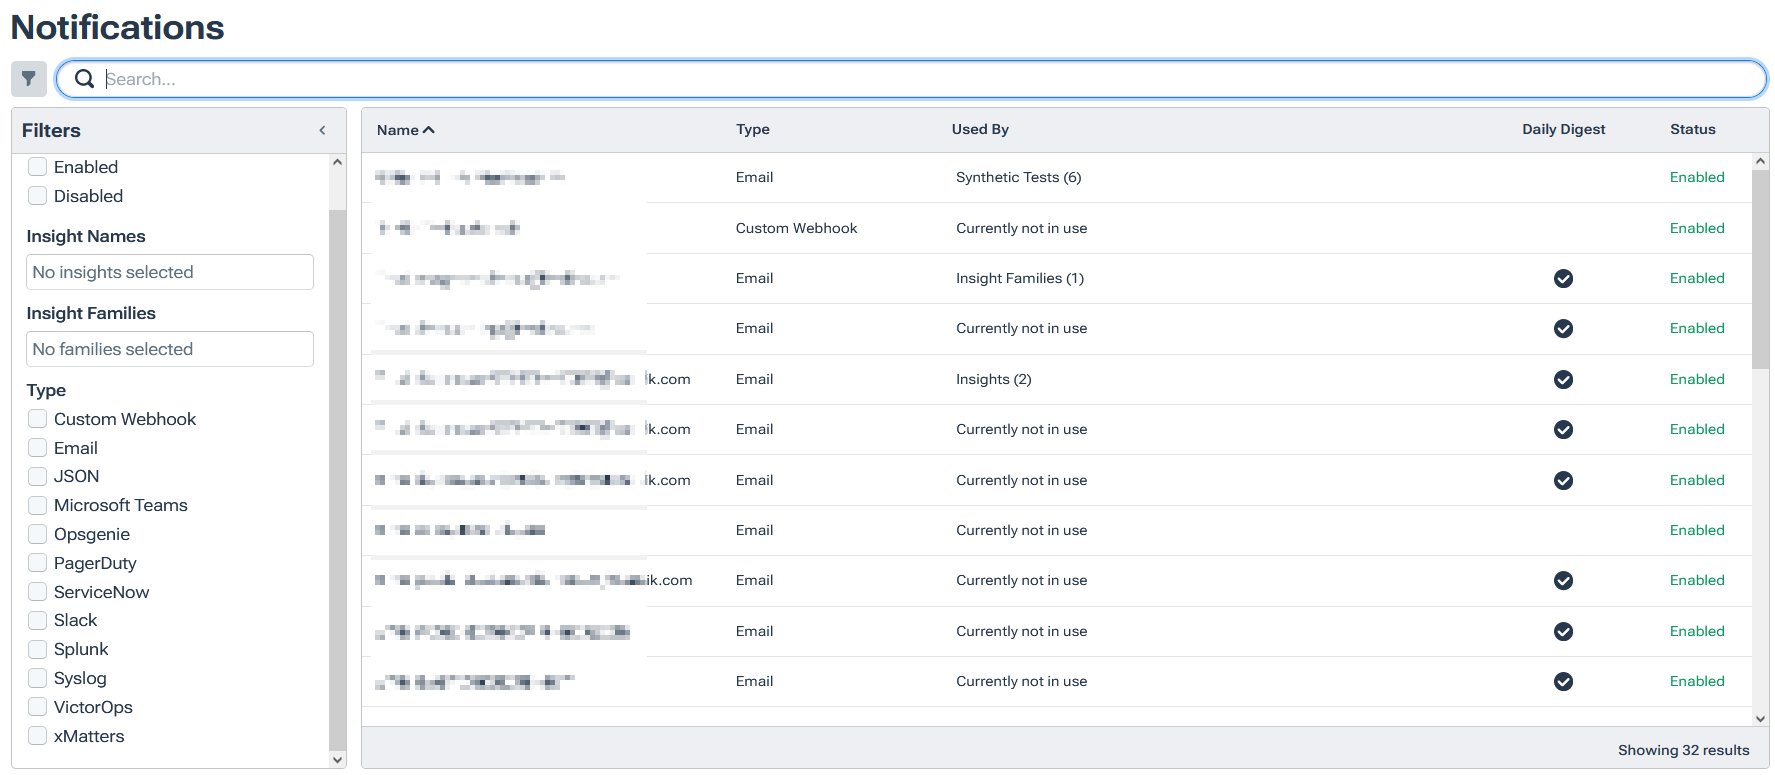
Kentik can alert you via various channels, including email, JSON, Slack, Microsoft Teams, custom webhooks, and more. You can configure who gets sent what and what channels are used on Kentik’s notification settings page.
To view existing alerts, click Alerting from Kentik’s menu. You’ll see a list of current alerts and their related metrics. You can filter these in various ways, such as by type, status, or severity. That’s extremely helpful as the number of your API monitoring alerts increases.
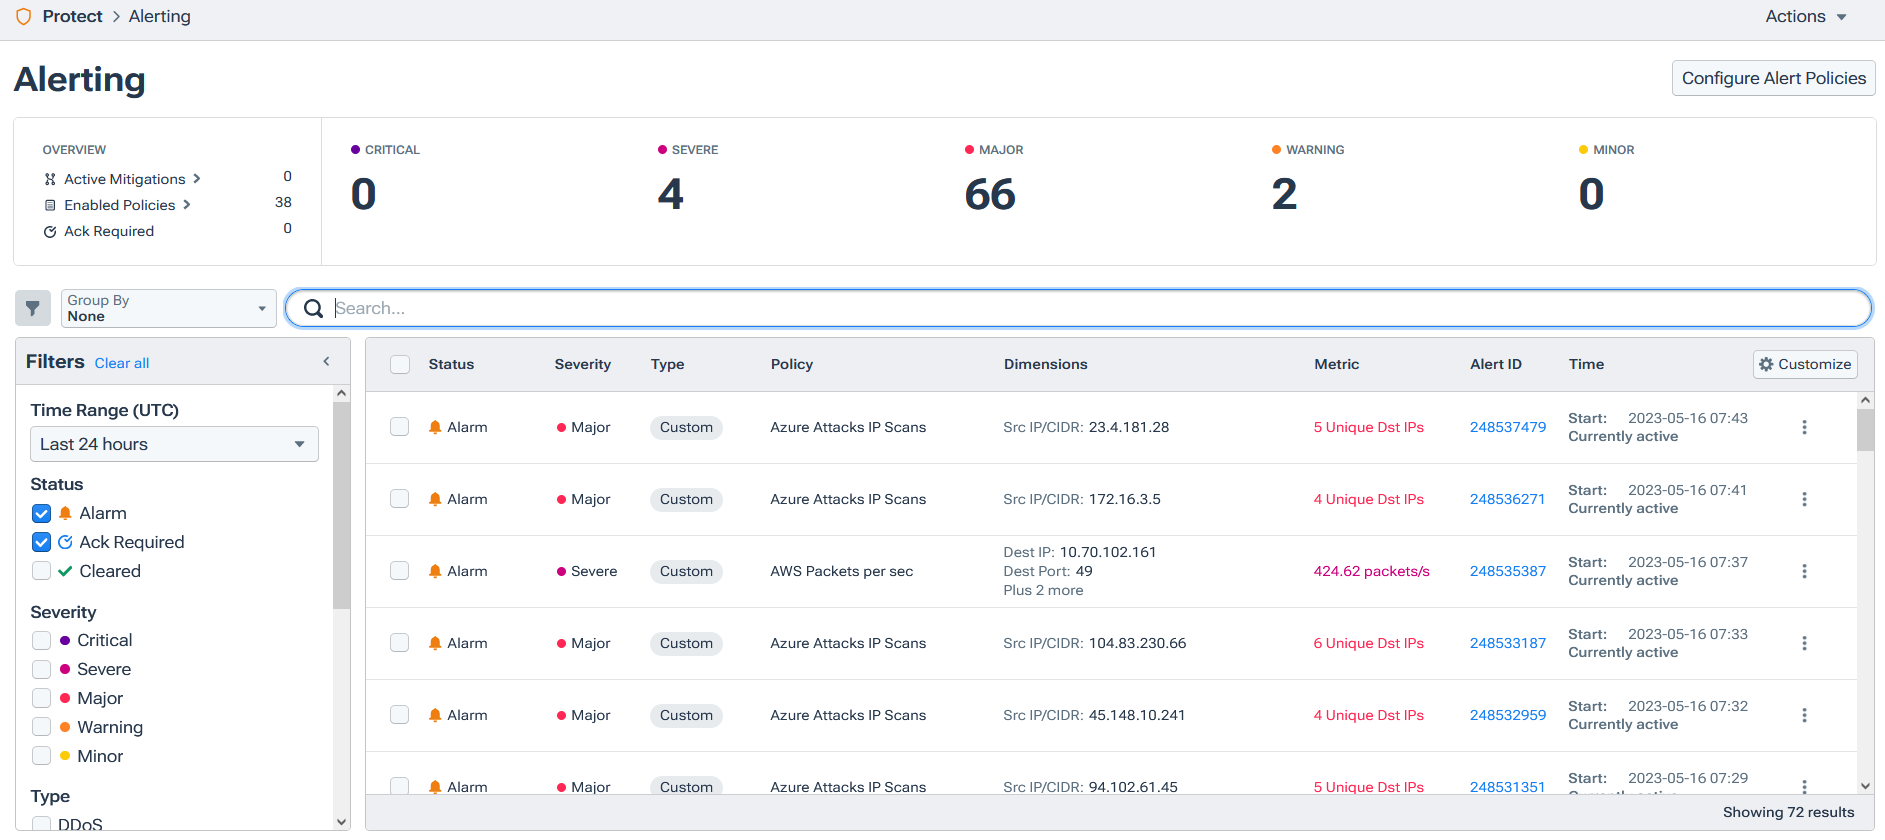
If you click Configure Alert Policies, you’ll see a list of policies available to you. Click the box next to each policy’s status to enable or disable it. On the Policy Templates page, you can set your own policies, defining the conditions for alerts yourself.
What to look for when choosing an API monitoring tool
Not all monitoring tools are created equal; picking one that matches your needs is essential. Easier said than done? Organize your research around a few considerations to narrow your options:
- Core features. Your API monitoring solution should be able to view all the networks in your infrastructure and collect all needed telemetry. 24x7 monitoring is also important—you don’t want gaps in your coverage. Instant alerts are another critical feature that helps you respond to issues in a timely manner. After all, detecting issues isn’t much help if you can’t respond to the problem quickly.
- Customization and flexibility. Your solution should allow you to customize rules, thresholds for notifications, and alerts via multiple channels easily if it truly fits your use case.
- Usability. Usable software encourages engagement. The UI needs to be easy to use and quick to work with. You should be able to easily find the metrics you need and set alerts and thresholds painlessly.
- Scalability. You want your system to keep working as your user base grows, and you don’t want to be babysitting your tools when you have cool new features to work on. Your monitoring solution should be capable of growing along with your API and not hold you back when traffic builds.
- Security. Your API monitoring system will store critical data and should do so securely. You need to be able to control who can access your monitoring tool and make sure its data is secure in transmission. Encryption in transit, as well as for stored data, is a significant feature to look for.
- Data collection and analysis. Your monitoring solution should provide tools to analyze and collect it. That should include all kinds of metrics options and a customizable dashboard where you can choose what is shown. Ideally, you should be able to build multiple dashboards for different use cases.
- Third-party integrations. Your solution should work well with the rest of your toolset and not just your API. It should be able to export data to other monitoring tools you use and your data center. It should be compatible with different hosting providers, container tools, and collaboration tools.
- Cost. Last but not least (and perhaps most obvious), your solution should fit within your budget and still provide sufficient value. You want a tool that saves your engineers time and detects problems before they become serious. Flexible pricing options are also helpful, particularly if you expect significant growth.
Conclusion
API monitoring is an essential part of service delivery. It helps you understand what’s working within your API and what needs attention. With a proper monitoring tool, you can automate many tasks that would be impractical to do manually, especially at scale. Take full advantage of your chosen solution’s power, and you’ll be able to keep your services running well, giving your users the best experience possible.
Fulfill your SLAs with ease with Kentik, and lower your costs while you’re at it. To try Kentik, sign up for a free trial or request a demo for a personalized walkthrough on how it can become your perfect API monitoring solution.

