Posts by Jim Meehan


About Jim Meehan
Jim Meehan is the director of product marketing at Kentik. For more than two decades, he has worked as a security and networking technologist in a variety of roles, including founder, technical sales leader, network architect, and software developer. Prior to Kentik, Jim designed infrastructure for several Silicon Valley startups, and delivered Arbor Networks’ enterprise security, network visibility and DDoS mitigation products to a who’s-who of online enterprises. Before that, he co-founded one of the first dial-up ISPs in the Chicago area and founded a DSL provider that beat AT&T to market in much of NW metro Chicago — all while still in high school. As a volunteer, he has written thousands of lines of custom code for Drupal and CiviCRM at Bay Area Children’s Theatre, where his wife is co-founder and executive director. He’s also dad to three children, two boys and a girl.
Gartner recently published its 2019 version of the Market Guide for AIOps Platforms. In this post, we examine our understanding of the report and discuss how Kentik’s domain-centric AIOps platform is built from the ground up for network professionals.
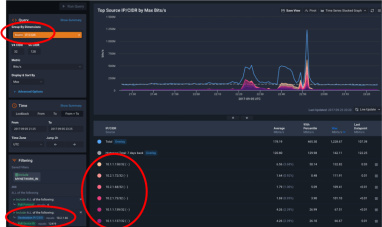
Disney+ launched with an impressive debut, especially considering that technical problems, potentially capacity issues, plagued the service shortly after launch. In this post, we look at Disney+ traffic peaks around launch. We also explain why, during high-profile launches like that of Disney+, broadband subscribers are likely to blame their provider for any perceived problems. Network operators must be able to understand the dynamics of new loads placed on the network by new services and plan accordingly.
Kentik’s Jim Meehan and Crystal Li share their insights from VMworld 2019, with a focus on news from the worlds of networking, multi-cloud, Kubernetes and security.
Kentik’s Jim Meehan and Crystal Li report on what they learned from speaking with enterprise network professionals at Cisco Live 2019, and what those attendees expect from a truly modern network analytics solution.
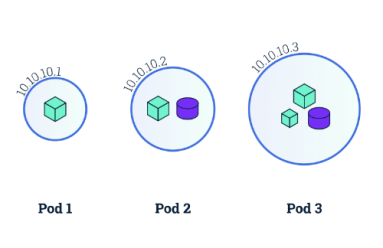
In this blog post, we provide a starting point for understanding the networking model behind Kubernetes and how to make Kubernetes networking simpler and more efficient.
There are five network-related cloud deployment mistakes that you might not be aware of, but that can negate the cloud benefits you’re hoping to achieve. In this post, we provide an overview of each mistake and a guide for avoiding them all.
At recent AWS re:Invent, we heard many attendees talking about the push for cloud-native to foster innovation and speed up development. In this post, we take a deeper dive on what it means to be cloud-native, as well as the challenges and how to overcome them.
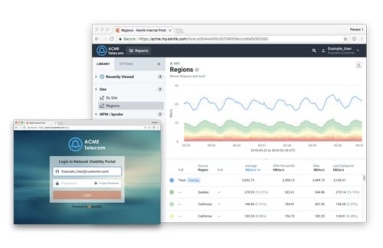
Service assurance and incident response are just one side of the network performance coin. What if you could use the same data to provide additional value to customers, and highlight the great service you provide? Today we announced the “My Kentik” portal to do just that. Read the details in this post.
VPC Flow Logs Blog Post: The migration of applications from traditional data centers to cloud infrastructure is well underway. In this post, we discuss Kentik’s new product expansion to support Google’s VPC Flow Logs.
While data networks are pervasive in every modern digital organization, there are few other industries that rely on them more than the Financial Services Industry. In this blog post, we dig into the challenges and highlight the opportunities for network visibility in FinServ.
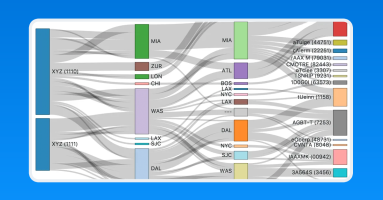
Sankey diagrams were first invented by Captain Matthew Sankey in 1898. Since then they have been adopted in a number of industries such as energy and manufacturing. In this post, we will take a look at how they can be used to represent the relationships within network data.
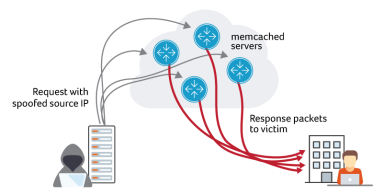
Attackers are using memcached to launch DDoS attacks. Multiple Kentik customers have reported experiencing the attack activity. It started over the weekend, with several external sources and mailing lists reporting increased spikes on Tuesday. In this blog post, we look at what our platform reveals about these attacks.
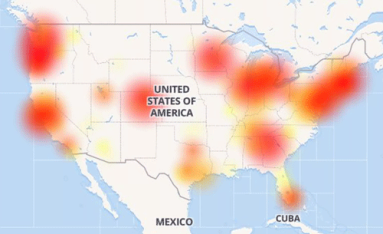
As last week’s misconfigured BGP routes from backbone provider Level 3 caused Internet outages across the nation, the monitoring and troubleshooting capabilities of Kentik Detect enabled us to identify the most-affected providers and assess the performance impact on our own customers. In this post we show how we did it and how our new ability to alert on performance metrics will make it even easier for Kentik customers to respond rapidly to similar incidents in the future.
At Kentik, we built Kentik Detect, our production SaaS platform, on a microservices architecture. We also use Kentik for monitoring our own infrastructure. Drawing on a variety of real-life incidents as examples, this post looks at how the alerts we get — and the details that we’re able to see when we drill down deep into the data — enable us to rapidly troubleshoot and resolve network-related issues.
With much of the country looking skyward during the solar eclipse, you might wonder how much of an effect there was on network traffic. Was there a drastic drop as millions of watchers were briefly uncoupled from their screens? Or was that offset by a massive jump in live streaming and photo uploads? In this post we report on what we found using forensic analytics in Kentik Detect to slice traffic based on how and where usage patterns changed during the event.
NetFlow data has a lot to tell you about the traffic across your network, but it may require significant resources to collect. That’s why many network managers choose to collect flow data on a sampled subset of total traffic. In this post we look at some testing we did here at Kentik to determine if sampling prevents us from seeing low-volume traffic flows in the context of high overall traffic volume.
SDN holds lots of promise, but it’s practical applications have so far been limited to discrete use cases like customer provisioning or service scaling. The long-term goal is true dynamic control, but that requires comprehensive traffic intelligence in real time at full scale. As our customers are discovering, Kentik Detect’s traffic visibility, anomaly detection, and extensive APIs make it an ideal source for actionable traffic data that can drive network automation.
Without package tracking, FedEx wouldn’t know how directly a package got to its destination or how to improve service and efficiency. 25 years into the commercial Internet, most service providers find themselves in just that situation, with no easy way to tell where an individual customer’s traffic exited the network. With Kentik Detect’s new Ultimate Exit feature, those days are over. Learn how Kentik’s per-customer traffic breakdown gives providers a competitive edge.
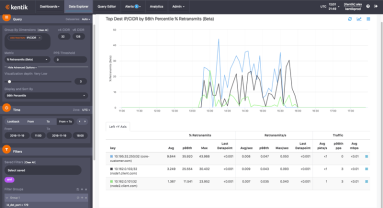
How does Kentik NPM help you track down network performance issues? In this post by Jim Meehan, Director of Solutions Engineering, we look at how we recently used our own NPM solution to determine if a spike in retransmits was due to network issues or a software update we’d made on our application servers. You’ll see how we ruled out the software update, and were then able to narrow the source of the issue to a specific route using BGP AS Path.
Traffic can get from anywhere to anywhere on the Internet, but that doesn’t mean all networks are directly connected. Instead, each network operator chooses the networks with which to connect. Both business and technical considerations are involved, and the ability to identify prime candidates for peering or transit offers significant competitive advantages. In this post we look at the benefits of intelligent interconnects and how networks can find the best peers to connect with.
In part 2 of our tour of Kentik Data Engine, the distributed backend that powers Kentik Detect, we continue our look at some of the key features that enable extraordinarily fast response to ad hoc queries even over huge volumes of data. Querying KDE directly in SQL, we use actual query results to quantify the speed of KDE’s results while also showing the depth of the insights that Kentik Detect can provide.
Kentik Detect’s backend is Kentik Data Engine (KDE), a distributed datastore that’s architected to ingest IP flow records and related network data at backbone scale and to execute exceedingly fast ad-hoc queries over very large datasets, making it optimal for both real-time and historical analysis of network traffic. In this series, we take a tour of KDE, using standard Postgres CLI query syntax to explore and quantify a variety of performance and scale characteristics.
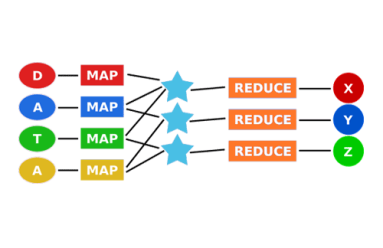
As the first widely accessible distributed-computing platform for large datasets, Hadoop is great for batch processing data. But when you need real-time answers to questions that can’t be fully defined in advance, the MapReduce architecture doesn’t scale. In this post we look at where Hadoop falls short, and we explore newer approaches to distributed computing that can deliver the scale and speed required for network analytics.
The plummeting cost of storage and CPU allows us to apply distributed computing technology to network visibility, enabling long-term retention and fast ad hoc querying of metadata. In this post we look at what network metadata actually is and how its applications for everyday network operations — and its benefits for business — are distinct from the national security uses that make the news.
In part 2 of this series, we look at how Big Data in the cloud enables network visibility solutions to finally take full advantage of NetFlow and BGP. Without the constraints of legacy architectures, network data (flow, path, and geo) can be unified and queries covering billions of records can return results in seconds. Meanwhile the centrality of networks to nearly all operations makes state-of-the-art visibility essential for businesses to thrive.
Clear, comprehensive, and timely information is essential for effective network operations. For Internet-related traffic, there’s no better source of that information than NetFlow and BGP. In this series we’ll look at how we got from the first iterations of NetFlow and BGP to the fully realized network visibility systems that can be built around these protocols today.
If your network visibility tool lets you query only those flow details that you’ve specified in advance then you’re likely vulnerable to threats that you haven’t anticipated. In this post we’ll explore how SQL querying of Kentik Detect’s unified, full-resolution datastore enables you to drill into traffic anomalies, to identify threats, and to define alerts that notify you when similar issues recur.
