Kentik Blog: How-To


Virtual Private Cloud (VPC) flow logs are essential for monitoring and troubleshooting network traffic in an AWS environment. In this article, we’ll guide you through the process of writing AWS flow logs to an S3 bucket.
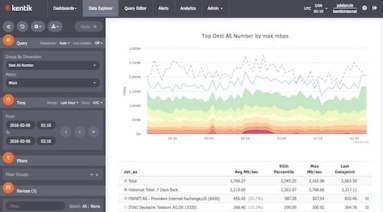
Unless you’re a Tier 1 provider, IP transit is a significant cost of providing Internet service or operating a digital business. To minimize the pain, your network monitoring tools would ideally show you historical route utilization and notify you before the traffic volume on any path triggers added fees. In this post we look at how Kentik Detect is able to do just that, and we show how our Data Explorer is used to drill down on the details of route utilization.
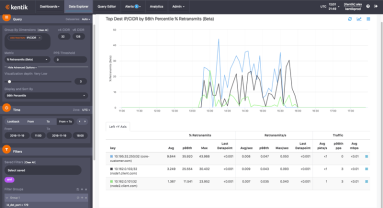
How does Kentik NPM help you track down network performance issues? In this post by Jim Meehan, Director of Solutions Engineering, we look at how we recently used our own NPM solution to determine if a spike in retransmits was due to network issues or a software update we’d made on our application servers. You’ll see how we ruled out the software update, and were then able to narrow the source of the issue to a specific route using BGP AS Path.
Destination-based Remotely Triggered Black-Hole routing (RTBH) is an incredibly effective and very cost-effective method of protecting your network during a DDoS attack. And with Kentik’s advanced Alerting system, automated RTBH is also relatively simple to configure. In this post, Kentik Customer Success Engineer Dan Rohan guides us through the process step by step.
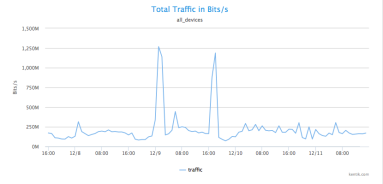
The network data collected by Kentik Detect isn’t limited to portal-only access; it can also be queried via SQL client or using Kentik’s RESTful APIs. In this how-to, we look how service providers can use our Data Explorer API to integrate traffic graphs into a customer portal, creating added-value content that can differentiate a provider from its competitors while keeping customers committed and engaged.
In part 2 of our tour of Kentik Data Engine, the distributed backend that powers Kentik Detect, we continue our look at some of the key features that enable extraordinarily fast response to ad hoc queries even over huge volumes of data. Querying KDE directly in SQL, we use actual query results to quantify the speed of KDE’s results while also showing the depth of the insights that Kentik Detect can provide.
Kentik Detect’s backend is Kentik Data Engine (KDE), a distributed datastore that’s architected to ingest IP flow records and related network data at backbone scale and to execute exceedingly fast ad-hoc queries over very large datasets, making it optimal for both real-time and historical analysis of network traffic. In this series, we take a tour of KDE, using standard Postgres CLI query syntax to explore and quantify a variety of performance and scale characteristics.
By actively exploring network traffic with Kentik Detect you can reveal attacks and exploits that you haven’t already anticipated in your alerts. In previous posts we showed a range of techniques that help determine whether anomalous traffic indicates that a DDoS attack is underway. This time we dig deeper, gathering the actionable intelligence required to mitigate an attack without disrupting legitimate traffic.
With massive data capacity and analytical flexibility, Kentik Detect makes it easy to actively explore network traffic. In this post we look at how to use this capability to rapidly discover and analyze interesting and potentially important DDoS and other attack vectors. We start with filtering by source geo, then zoom in on a time-span with anomalous traffic. By looking at unique source IPs and grouping traffic by destination IP we find both the source and the target of an attack.
If your network visibility tool lets you query only those flow details that you’ve specified in advance then you’re likely vulnerable to threats that you haven’t anticipated. In this post we’ll explore how SQL querying of Kentik Detect’s unified, full-resolution datastore enables you to drill into traffic anomalies, to identify threats, and to define alerts that notify you when similar issues recur.
Kentik Detect’s alerting system generates notifications when network traffic meets user-defined conditions. Notifications containing details about the triggering conditions and the current status may be posted as JSON to Syslog and/or URL. This post shows how to parse the JSON with PHP to enable integration with external ticketing and configuration management systems.
Relational databases like PostgreSQL have long been dominant for data storage and access, but sometimes you need access from your application to data that’s either in a different database format, in a non-relational database, or not in a database at all. As shown in this “how-to” post, you can do that with PostgreSQL’s Foreign Data Wrapper feature.
