Kentik Blog: Network Monitoring


It’s no exaggeration to say the network has transformed dramatically: Hybrid cloud architectures and AI-powered infrastructure seem to expand in scale and complexity every day. But legacy tools to monitor and observe these networks have not kept up. Let’s directly compare the fragmented world of legacy network monitoring with network intelligence, and an all-in-one SaaS platform that unifies metrics, flow, cloud, and AI.
In today’s high-performance data centers, “all green” dashboards can mask catastrophic issues hiding just beneath the surface. If you’re missing the microbursts, hidden oversubscription, and routing imbalances that are devastating application performance, you’re flying blind. Learn how to close these visibility gaps and shift from reactive firefighting to proactive network intelligence.
Flow data has always held immense potential, but was often inaccessible because it lacked context and speed. Kentik removes that friction by automatically enriching flow with human-readable context, making it a daily driver for everyone, not just specialists.
The network is the metaphorical plumbing through which all your precious non-metaphorical observability and monitoring data flows. It holds secrets you’ll never find anywhere else. And it’s more important today than ever before.
Traditional network monitoring systems can’t meet the dynamic demands of modern business networks. Modern NMSs built with SaaS-native architecture enable enterprises to deliver exceptional customer experiences, powered by scalable, high-performance, innovative monitoring.
In this post, I’m going to point out some of the opportunities you have in front of you not only because you now have Kentik NMS up and running, but more importantly, as a result of all the hard work you did to get here.
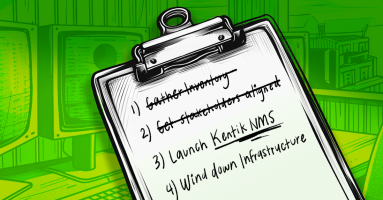
The time has come to switch to your new network monitoring solution. Remember, if an alert, report, ticket, or notification does not spark joy, get rid of it. We’ll cover how to spin up Kentik NMS and ensure you’re ready to sunset your old solution for good.
Migrating network monitoring solutions is more than just a list of devices and technical requirements. It’s also about ensuring that all stakeholders are aligned - from team members to customers and everyone in between.
Network monitoring tools have a lot of moving parts. Those parts end up getting stored in a wide range of locations, formats, and even the ways various capabilities are conceptualized. With that in mind, we’re going to list out the information you should gather, the format(s) you should try to get it into, and why.
NMS can do so much that one blog topic triggered an idea for another, and another, and here we are, six posts later and I haven’t explained how to install NMS yet. The time for that post has come.
Leon takes a look at how to further modify SNMP metrics in Kentik NMS. Because sometimes, you want to modify data before displaying it in your network monitoring system. Ready? Let’s get mathy with it!
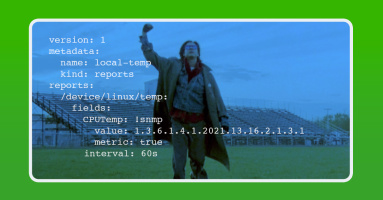
Kentik NMS has the ability to collect multiple SNMP objects (OIDs). Whether they are multiple unrelated OIDs, or multiple elements within a related table, Leon Adato walks you through the steps to get the data out of your devices and into your Kentik portal.
Kentik NMS collects valuable network data and then transforms it into usable information — information you can use to drive action.
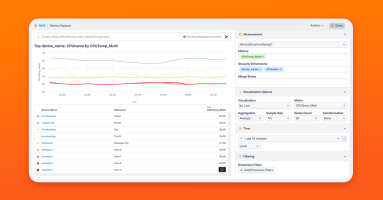
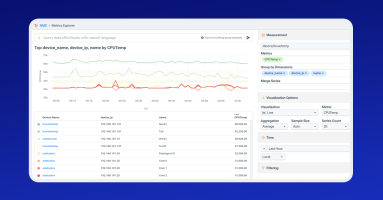
Out of the gate, NMS collects an impressive array of metrics and telemetry. But there will always be bits that need to be added. This brings me to the topic of today’s blog post: How to configure NMS to collect a custom SNMP metric.
While many wifi access points and SD-WAN controllers have a rich data set available via their APIs, most do not support exporting this data via SNMP or streaming telemetry. In this post, Justin Ryburn walks you through configuring Telegraf to feed API JSON data into Kentik NMS.
Streaming telemetry is the future of network monitoring. Kentik NMS is a modern network observability solution that supports streaming telemetry as a primary monitoring mechanism, but it also works for engineers running SNMP on legacy devices they just can’t get rid of. This hybrid approach is necessary for network engineers managing networks in the real world, and it makes it easy to migrate from SNMP to a modern monitoring strategy built on streaming telemetry.
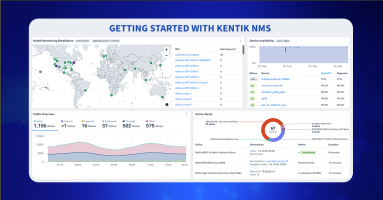
Kentik NMS is here to provide better network performance monitoring and observability. Read how to get started, from installation and configuration to a brief tour of what you can expect from Kentik’s new network monitoring solution.
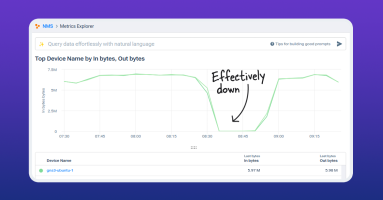
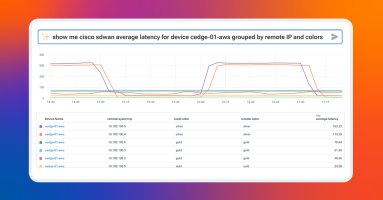
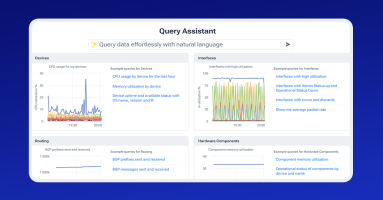
Kentik Journeys uses an AI-based, large language model to explore data from your network and troubleshoot problems in real time. Using natural language queries, Kentik Journeys is a huge step forward in leveraging AI to democratize data and make it simple for any engineer at any level to analyze network telemetry at scale.
Kentik NMS has launched and is setting sail in familiar waters. Monitoring with SNMP and streaming telemetry is only the first leg of the journey. In short order, we’ll unfurl additional options, increasing NMS’s velocity and maneuverability.
We’re bringing AI to network monitoring and observability. And adding new products to Kentik, including a modern NMS, to simplify troubleshooting complex networks.
Is SNMP on life support, or is it as relevant today as ever? The answer is more complicated than a simple yes or no. SNMP is reliable, customizable, and very widely supported. However, SNMP has some serious limitations, especially for modern network monitoring — limitations that streaming telemetry solves. In this post, learn about the advantages and drawbacks of SNMP and streaming telemetry and why they should both be a part of a network visibility strategy.
Let me tell you something you already know: Networks are more complex than ever. They are massive. They are confounding. Modern networks are obtuse superorganisms of switches, routers, containers, and overlays; a hodgepodge of telemetry from AWS, Azure, GCP, OCI, and sprawling infrastructure that spans more than a dozen timezones.
With the increasing reliance on SaaS applications in organizations and homes, monitoring connectivity and connection quality is crucial. In this post, learn how with Kentik’s State of the Internet, you can dive deep into the performance metrics of the most popular SaaS applications.
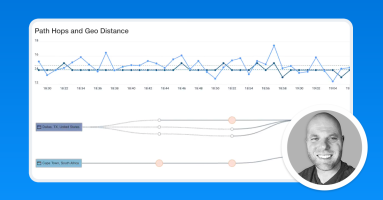
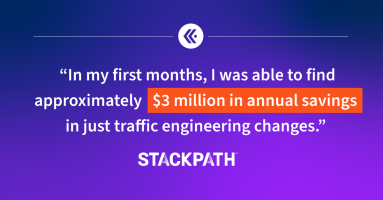
When your business is all about providing cloud services at the edge, optimizing the quality of your network connectivity is paramount to customer success. Learn how StackPath saved $3 million and optimized their network performance by using Kentik.


