Kentik Blog: Synthetic Monitoring


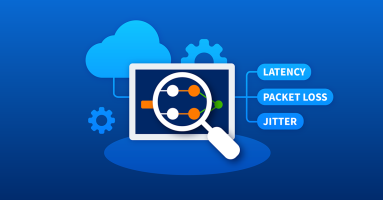
Discover how Kentik’s network observability platform aids in troubleshooting SaaS performance problems, offering a detailed view of packet loss, latency, jitter, DNS resolution time, and more. Phil Gervasi explains how to use Kentik’s synthetic testing and State of the Internet service to monitor popular SaaS providers like Microsoft 365.
API monitoring is the process of keeping tabs on the performance of your REST APIs. Learn how Kentik’s API monitoring tools let you identify bottlenecks, spot performance drops, and maintain API availability. Learn more in this API monitoring how-to tutorial.
The final installment of our three-part series explaining the process of using continuous synthetic testing as a comprehensive cloud monitoring solution to find problems before they start.
The second of a three-part guide series explaining the process of using continuous synthetic testing as a comprehensive cloud monitoring solution to find problems before they start.
The first in a three-part guide series explaining the process of using continuous synthetic testing as a comprehensive cloud monitoring solution to find problems before they start.
Investigating a user’s digital experience used to start with a help desk ticket, but with Kentik’s Synthetic Transaction Monitoring, you can proactively simulate and monitor a user’s interaction with any web application.
Kentik goes up the stack and launched Synthetic Transaction Monitoring (STM). Read this post to learn about enhancements to our synthetic testing capability and how to perform STM in Kentik.
By peeling back layers of your users’ interactions, you can investigate what’s going on in every aspect of their digital experience — from the network layer all the way to application.
When something goes wrong with a service, engineers need much more than legacy network visibility to get a complete picture of the problem. Here’s how synthetic monitoring helps.
In the second post of this multi-part series, Kentik’s Anil Murty will share how Kentik Synthetics helps you proactively monitor applications and services and troubleshoot the root cause of issues faster.
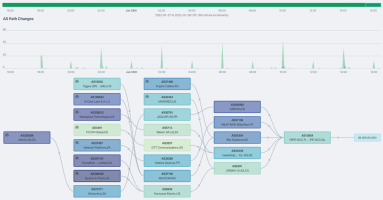
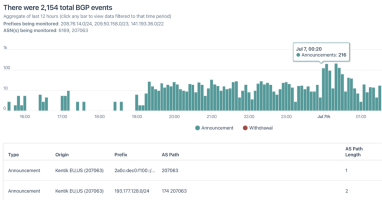
Kentik’s BGP monitoring capabilities address root-cause routing issues across BGP routes, BGP event tracking, hijack detection, and other BGP issues.
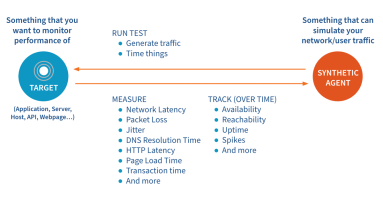
Synthetic monitoring can help you proactively track the performance and health of your networks, applications and services. In the first post of this multi-part series, Kentik’s Anil Murty will share how synthetic monitoring can also help you drive better business outcomes.
To monitor your SaaS applications, it has to be done by thinking creatively. Traditional tactics lack insight. It’s time to consider synthetic monitoring.
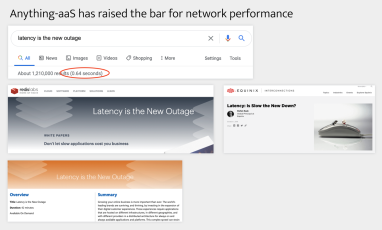
Adding more bandwidth from the business to the cloud is like adding more cowbell to Grazing in the Grass. In many cases, it won’t improve the end-user experience when latency is the real problem.
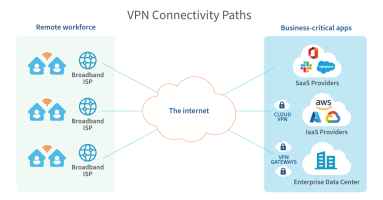
A company with thousands of remote employees connecting to the same SaaS applications will randomly experience slowness. How can we troubleshoot this sluggishness?
BGP is a critical network protocol, and yet, BGP is often not monitored. BGP issues that go unchecked can turn into major problems. This post explains how Kentik can help you to easily monitor BGP and catch critical issues quickly.
G-Core Labs uses Kentik Synthetics. With continuous, proactive monitoring in place, find out how G-Core Labs achieves fast, accurate visibility, reduced infrastructure costs, automation to save time, and the ability to uphold SLAs and maintain quality of service for customers.
Cloud solutions architect Ted Turner describes how Kentik Synthetics easily uncovers network-related latencies that often cascade into cloud application performance problems — DevOps teams take note.
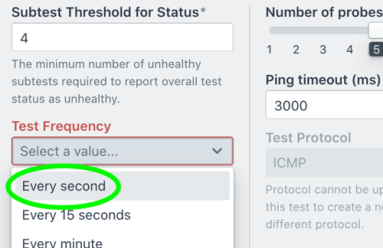
In this post, we show how Kentik Synthetic Monitoring supports high-frequency tests with sub-minute intervals, providing network teams with a tool that captures what’s happening in the network, including subtle degradations.
What is synthetic testing, and where do point solutions fail? In this blog post, Kentik Co-founder and CEO Avi Freedman discusses network performance testing and why Kentik designed an autonomous and affordable synthetic monitoring capability that is fully integrated into our network observability platform.
Kentik software engineer Will Glozer gives us a peek under the hood of Kentik’s new synthetic monitoring solution, explaining how and why Kentik used the Rust programming language to build its network monitoring agent.


