Summary
Service assurance and incident response are just one side of the network performance coin. What if you could use the same data to provide additional value to customers, and highlight the great service you provide? Today we announced the “My Kentik” portal to do just that. Read the details in this post.
For operations teams, delivering a great customer or user experience is paramount. Keeping the network performant and reliable is job number one, and most teams would agree that pervasive, real-time data is essential to accomplishing that task. Service assurance and incident response are just one side of the coin though. What if you could use the very same data to highlight to customers the great value that your service provides?
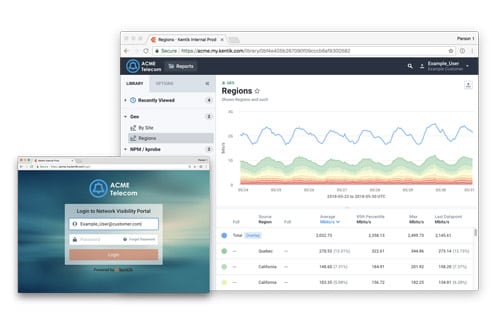
Today, we’re announcing the availability of “My Kentik” which allows Kentik customers to present filtered, curated views of network data to their own downstream customers or internal divisions. My Kentik is now a built-in part of the Kentik platform, and powered by the same datasets that Kentik already collects for service assurance, analytics, and reporting tasks. Delivered as a branded portal experience, My Kentik makes it easy for end customers to access both details and big-picture insights related to the services they purchase from the network provider.

My Kentik creates multiple new opportunities to leverage network data for increased value across the business:
- Reduce support and billing caseload by providing customers with self-service access to reports and data about their service utilization
- Increase the stickiness and perceived value of services with complimentary analytics and reporting
- Generate additional revenue by offering analytics as an add-on service.
My Kentik includes extensive GUI-driven customization capability for administrators so network providers can tailor dashboards and reports that are specific to the types of services they offer, or even specific to individual customers. Enterprises can provide curated views for each department, WAN site, or application team within a datacenter.
The types of views that can be provided range across the whole spectrum of services that providers or enterprises offer to downstream customers or internal divisions. Some example scenarios include:
- DDoS / MSSP providers: Views for each protected customer showing alerts and associated traffic details
- Peering exchanges: Traffic matrices by MAC or ASN and peering opportunity views for each exchange participant
- IP transit providers: Utilization by port and PoP, traffic breakdowns by geo, remote ASN, and traffic type for each transit customer
- Hosting / IaaS: Per-host and per site / PoP utilization, application / service breakdowns, on-net / off-net traffic breakdown for each hosting customer
- Enterprise: WAN traffic utilization, on / off-net breakdown, local and remote top talkers view, per cloud & SaaS provider breakdown for each department or WAN location
- Datacenter: Traffic matrix of provider / consumer services, top talker visibility, and network impact awareness for each application team
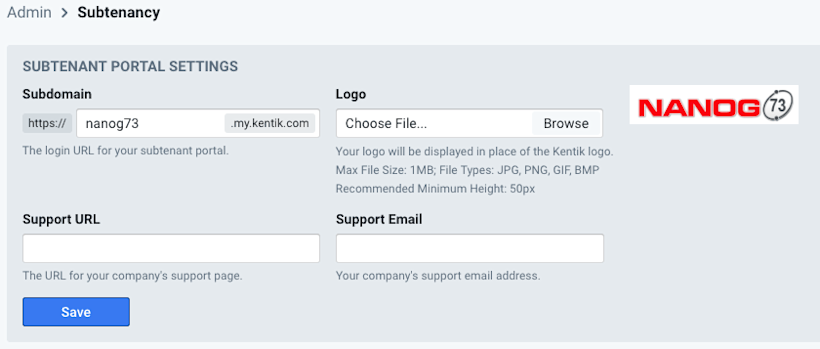
The configuration controls for My Kentik are provided within the Admin menu of the Kentik portal, and allow Kentik customers to create a custom URL and logo for downstream users to access their branded My Kentik portal.

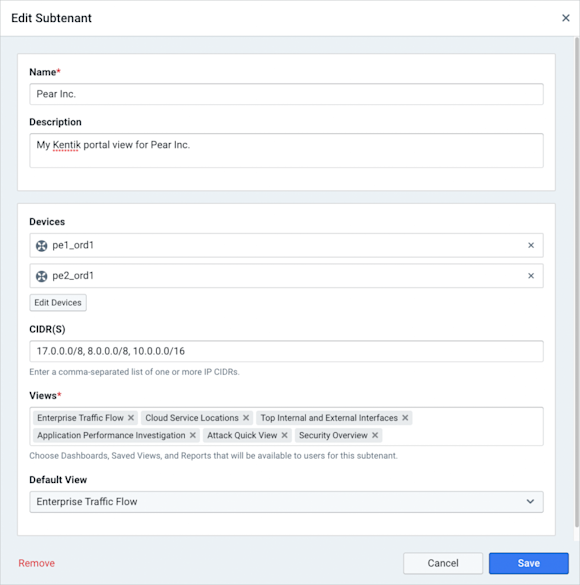
Configuring individual tenant customers is also straightforward, with controls for data filtering and which views are accessible. Admins within the individual tenants can also create logins for additional users to access that tenant’s views.

For additional information, please see the Subtenancy topic in the Kentik Knowledge Base or contact the Kentik Customer Success team at support@kentik.com.
My Kentik is available now for all Kentik customers, with a limited number of subtenants. For additional details about pricing packages for additional subtenants, please contact your Kentik account team or email sales@kentik.com.
