Exploring for Insights on Anomalous Network Traffic

Summary
By actively exploring network traffic with Kentik Detect you can reveal attacks and exploits that you haven’t already anticipated in your alerts. In previous posts we showed a range of techniques that help determine whether anomalous traffic indicates that a DDoS attack is underway. This time we dig deeper, gathering the actionable intelligence required to mitigate an attack without disrupting legitimate traffic.
Exploring for Insights on Anomalous Traffic

In our recent blog post DDoS Detection: Source Geography NetFlow Analysis we looked at how you can actively explore network traffic with Kentik Detect and discover attacks that you might not otherwise realize are happening. In particular, we saw that the Kentik Data Engine’s unrestricted capacity to store raw flow records (NetFlow, IPFIX, sFlow, etc.) allows you to start with a top-down view of all traffic and then use the portal’s toolset to see what’s going on from multiple angles. We filtered by source geo, zoomed into a time period, examined unique source IPs, and grouped traffic by destination IP. In the process we learned that a significant amount of attack traffic was coming from thousands of source IPs located in China and was aimed at a single destination IP: 10.10.10.10/32.
In this post, we’ll use some additional techniques enabled by the Kentik Detect toolset to understand even more about this attack. Beyond academic curiosity, what’s the value of deeper analysis? To begin with, there are many different DDoS attack vectors, so knowing the type of an attack can help mitigate it effectively without potentially stepping on legitimate traffic. Further, while a DDoS attack may be the obvious problem there may also be other sorts of attacks happening at the same time. Getting more detail helps ensure that you’re not ignoring a more pernicious threat.
Next analytical steps
Based on the large number of source IPs involved, it’s obvious that we’re dealing with a distributed denial of service (DDoS) attack. So it’s worth checking whether attack traffic is coming from other countries besides China. Starting where we left off in the previous post, we do this by removing our China-specific traffic filter (click the blue X at upper right of the filter specifying src_geo = CN). Lo and behold, there is indeed DDoS traffic coming from multiple countries including the U.S., Japan, Russia, Sweden, China, Taiwan, Brazil, and Estonia. Good to know.
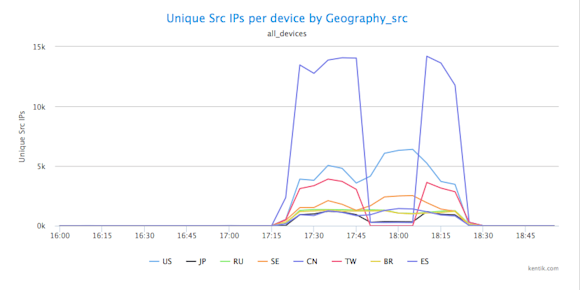
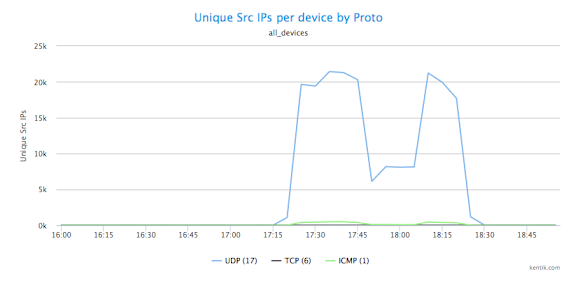
Next we want to know specifically what type of traffic we’re seeing and what that tells us about the type of attack on 10.10.10.10/32. First we’ll look at what protocol the traffic consists of. We can do this in multiple ways. In our source country analysis our Units menu setting was Unique Src IPs; by now choosing Full » Proto from the drop-down Metric menu we can see how traffic is distributed amongst different protocols:
We can also easily shift to looking at per-protocol traffic measured in packets per second by choosing Packets from the Units menu:
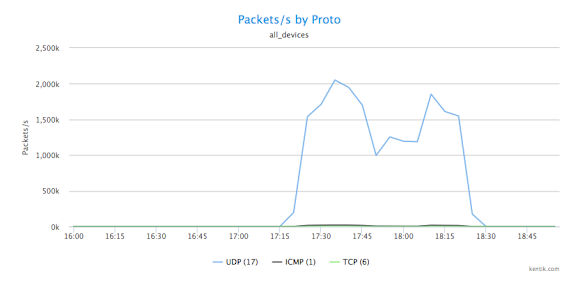
In both cases, it’s quite clear that we’re dealing with a UDP-based attack. So next, to shed further light on the nature of the DDoS attack, we want to know the port that this UDP traffic is aimed at. To see that, we go back to the Metrics menu and choose Destination » Port.
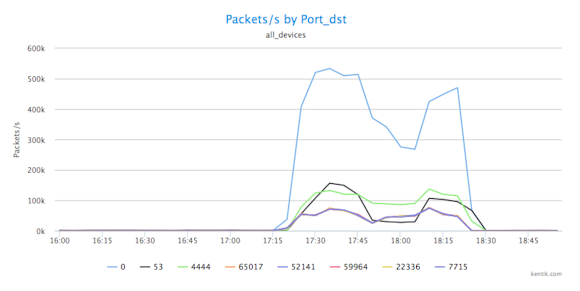
So now we can see that the UDP traffic is being sent to multiple ports, and it’s obvious that we’re experiencing a DNS redirection/amplification attack occurring on port 53, with a lot of port 0 UDP packet fragments being generated as collateral traffic.
Behind the DDoS diversion
So far we’ve gotten a lot of insight into the details of the DDoS attack. But we don’t yet know whether that attack is actually the main event or simply a diversion from other, less obvious threats. We can get an initial feel for this by looking a little deeper at the ports involved. What we see is that in addition to 0 and 53 there’s a fairly high level of packets per second being thrown at port 4444 (green line in graph). Port 4444 is the UDP port for the Kerberos service, and is — at least for Windows machines — a well-known target for buffer overflow attacks, often used to insert trojans like Trojan, Hlinic, and Crackdown.
What’s interesting about this is that there are potentially two types of attacks going on in parallel: a DDoS attack and a buffer overflow trojan insertion. Many security blogs and publications have noted that in 2015 it has become more common for DDoS attacks to be used as a way to obfuscate other exploits, and this may very well be an example of that technique.
What we’ve learned so far is that by using Kentik Detect’s access to raw (unsummarized) flow records and the portal’s many flexible pivots for analysis we can find more than what a traditional pre-defined DDoS alert would have told us. This helps us not only to see and understand threats that we uncover by exploring, but also to apply these types of analyses in alerts that will generate notifications when a similar situation arises again.
Better-informed attack mitigation
It’s great to be able to satisfy our curiosity about anomalous traffic, but now that we recognize that we’re under attack and we understand the nature of that attack, the main focus shifts to insights that can inform our response. A straightforward analysis to give us some actionable intelligence would be to see all of the /24 source network addresses of the UDP traffic pointed at 10.10.10.10/32 from the source countries of the attack. Starting from our Packets/s by Port_dst view above, we do this by choosing Source » IP/CIDR on the Metric menu and entering 24 for the CIDR level. Here’s the table from that view, which allows us to easily identify which /24s are the heaviest senders.

Armed with this information, we’re now able to take a couple of concrete steps to mitigate the attack traffic:
- Ask our upstream ISP to drop this traffic.
- As an added precaution, drop all traffic from these countries going to port 4444 on our own routers.
Conclusion
Over the course of our posts on DDoS detection, we’ve seen how explorative analysis can find attacks and exploits that may not have surfaced from an alert. Kentik Detect is exceptionally well-suited to these explorations because it stores complete, dis-aggregated flow records enhanced with GeoIP information and it also offers extensive analytical pivots, not only in the portal (as we’ve demonstrated) but also via psql client or our REST APIs. As a result, Kentik Detect enables much deeper insights about the nature of anomalies and attacks. While we began this analytical exercise with source geography as the starting point, I hope it’s become clear that there are many starting points as well as analytical options to use in understanding — and protecting — your network traffic.
Read our solution brief to learn more about Kentik DDoS Detection and Defense.

