Exploring Your Network Data With Kentik Data Explorer


Summary
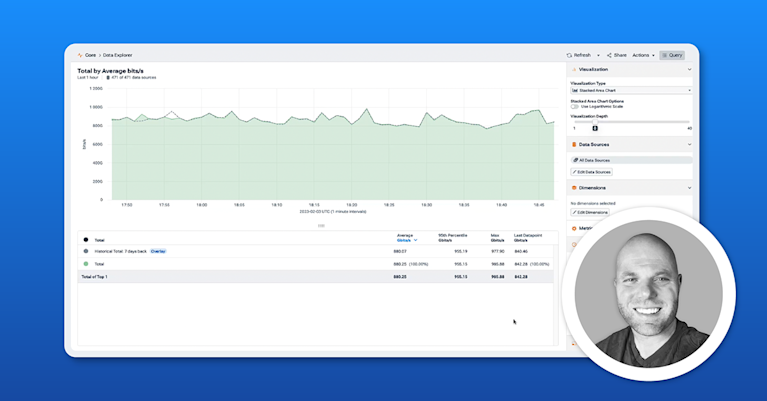
A cornerstone of network observability is the ability to ask any question of your network. In this post, we’ll look at the Kentik Data Explorer, the interface between an engineer and the vast database of telemetry within the Kentik platform. With the Data Explorer, an engineer can very quickly parse and filter the database in any manner and get back the results in almost any form.
A cornerstone of network observability is the ability to ask any question of your network. That means having an unbound capacity to explore the tremendous amount and variety of network telemetry you collect. It means seeing trends and patterns from a macro level, but it also means getting very granular to pursue any line of analysis of your data.
Collecting information from flow records, SNMP, streaming telemetry, BGP, eBPF, and so on is indeed very important. Still, it will be useless if it takes forever to do anything meaningful with that data. What’s almost as important as the data is the ability to query that data very quickly according to your specific role or needs.
The problem with so much data
The problem is that when you collect telemetry from today’s network, you’re collecting information from your campus, data center(s), WAN, public cloud resources, container environments, etc. It’s a tremendous amount of information and highly varied in type and format.
Querying such a large database, or more likely multiple databases can take a very long time which isn’t an option when triaging an incident. The whole point of collecting all of this data is to mine out answers to our questions and to solve problems. Because flow records alone can comprise millions of lines in a database, trying to mine out specific answers can be almost pointless if it takes too long or gives us inaccurate results.
So how can we faster process the data in such a massive database?
The need for speed
The Kentik Data Explorer is Kentik’s interface between you as an engineer, whether that’s network, systems, cloud, security, or SRE, and the database of information you’ve collected with the Kentik platform.
Using the Kentik Data Explorer, you can manually explore all that data, which is stored in the main tables of the Kentik Data Engine. But the real key here is that the Kentik Data Explorer was purpose-built for querying a massive database. Speed and efficiency were the main drivers in its development from the start.
Though massive, the underlying database itself is also highly distributed among many servers and locations, making getting the data and serving the data needed for a query happen in parallel. So instead of querying data in a monolithic stack of iron (or virtual iron), we use a distributed cluster of compute resources.
Now you can quickly filter an extensive database on specific parameters such as time range, various data sources and types, and hundreds of dimensions such as IP addresses, ASNs, application and security tags, container information, the fields inside VPC flow logs, and much more.
“Previously, we didn’t have anywhere near the granularity of data we have with Kentik.”
– Jurriën Rasing, Group Product Manager for Platform EngineeringAsk any question about your network
Being able to parse the data the way you need to is critical to making progress with troubleshooting and analysis. Imagine collecting all of this great information from all over your network, the cloud, containers, etc., but being unable to zoom in on precisely what you need for your specific issue.
With Data Explorer, you can query the database using built-in filters, or you can create custom ones, which is key to being able to pursue any line of questioning of your network data. Look at the graphic below in which you can see dozens of different dimensions on which you can filter. In a live screen (see the video below), you can also scroll down and see dozens more dimensions organized in categories like network devices, public cloud, containers, etc.

Data Explorer represents the entire underlying database, so whether you’re doing a security investigation, trying to figure out why an app is slow, figuring out the path your traffic is taking from public cloud to public cloud, or anything else you can think of, the data is there. But this means you need to be able to get the data back in the way that makes the most sense to you.

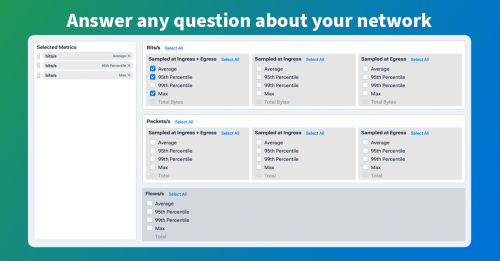
Is seeing the data in bits per second more relevant than packets per second? Are you more interested in source IP than destination IP? You can get back the results based on any metric or combination that matters to you, and if you know networking, you also know that it can get pretty complex.
In the graphics above, we saw the many dimensions you can filter on, and in the graphic below, you can see just a small sample of the dozens and dozens of metrics that you can use to refine your search results.

With just a few clicks, you can mine the database for TCP retransmits, TCP fragments, client latency, flow information, and dozens of other metrics. This means you can use Data Explorer to follow any line of analysis you need to solve various complex problems beyond just seeing CPU utilization and CRC errors on a pretty graph.
The idea is an unbound, efficient ability to explore all of the very different types of network telemetry in the database. In other words, ask any question you want — and find the answer you need.
See the Data Explorer in action this short demo.


