Faster Network Troubleshooting with Kentik AI

Summary
When network issues strike, every second matters. Latency or packet loss can frustrate users and hurt revenue. Learn how Kentik AI uses natural language to speed up troubleshooting and isolate problems quickly.
When things go wrong, it is often a race against time to figure out what’s happening and get it fixed. Whether resulting in latency or completely unreachable services, issues can have harmful effects on the business as users grow frustrated and abandon their transactions to go elsewhere. Observability tools have gotten very good at detecting when these things happen, but many times, especially where the dynamic complexities of the network are involved, isolating the root cause requires a network engineer to roll up their sleeves and start digging into complex network data and logs – a time-consuming process when time is of the essence.
Kentik Journeys provides a new solution in the network engineer’s toolbox to reduce the time and effort it takes to troubleshoot network issues when they occur by allowing engineers to use natural language and AI-augmented analysis to dig into network data. It then allows you to systematically ask follow-up questions to continue probing data as you follow the proverbial trail of breadcrumbs toward the root cause. And since application delivery relies on many network and network-adjacent components and services, we’ve designed Journeys to work across the entire Kentik product surface.
Let’s take a look at how it works in a real situation.
In this scenario, users have reported an application performance issue. Specifically, the connection to the application breaks intermittently, and it’s getting in the way of getting work done. Additionally, we know that the location is connected to on-prem data centers and the public cloud by a Cisco SD-WAN, which the application’s local PostgreSQL mechanism uses to connect to the resources it needs.
Let’s see how Journeys helps us identify the cause quickly.
Natural language troubleshooting with Journeys
Step 1
First, we select “New Journey” to start the process. Because we intend to keep this entire conversation to refer to later, we’ll give it a more useful name, in this case, “SD-WAN Troubleshooting.”
Journeys supports any queries related to flow data, which would typically be visible in Data Explorer, as well as metrics from SNMP and streaming telemetry, which we’d typically see in Kentik NMS Metrics Explorer.
Let’s start troubleshooting by querying traffic from our Cisco SD-WAN network segment over the last 6 hours.
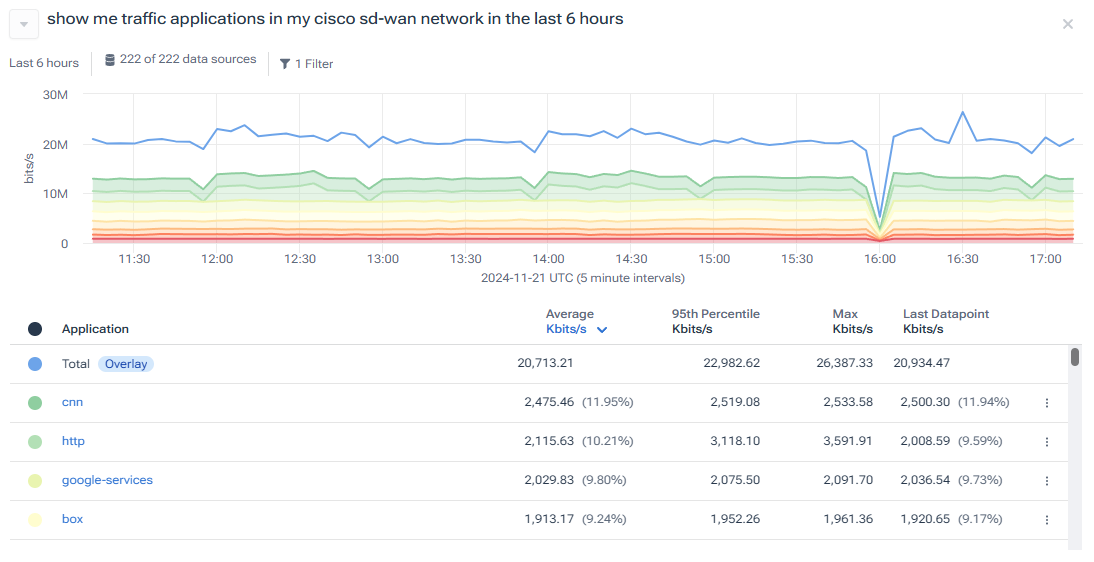
This natural language prompt is sent to a large language model to interpret before sending back a value Data Explorer query for Kentik to run. As you can see, a new graph and table are generated, showing traffic grouped by application.
In this output above, we can see the applications traversing our SD-WAN devices, which is a good start, but the application we’re interested in likely has low-volume traffic, and it is not visible in the TOP applications.
Step 2
Let’s filter this traffic just on the PostgreSQL application by typing “Filter this to postgresql.”
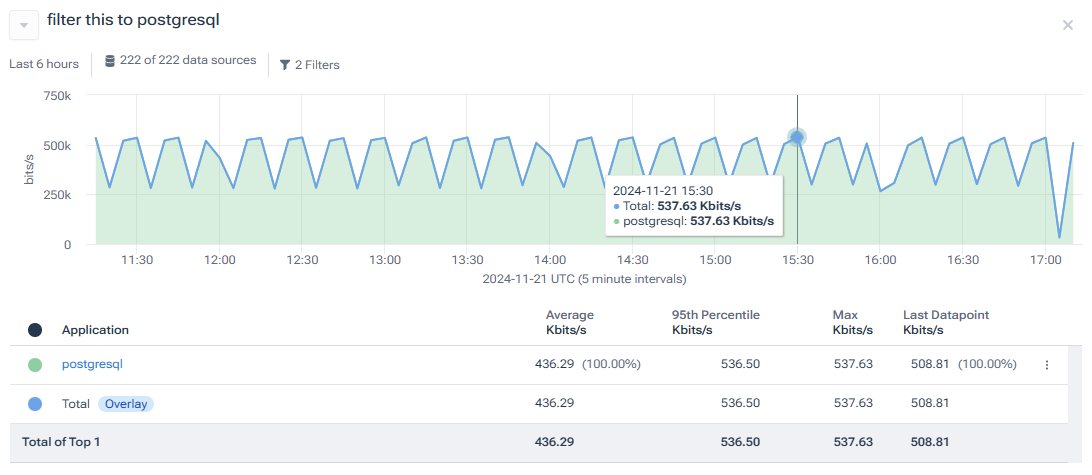
Journeys interprets this to add a new filter on top of the existing query, and we now only see PostgreSQL traffic presented.
Tip: You can also skip this step and just ask for PostgreSQL traffic right off the bat by asking something like “show me postgresql application traffic in my Cisco SD-WAN network in the last 6 hours.”
Step 3
We know that the PostgreSQL traffic is problematic on certain sites, so we want to add site and device dimensions to this view. This is simply done by asking Journeys to “add sites and devices.”
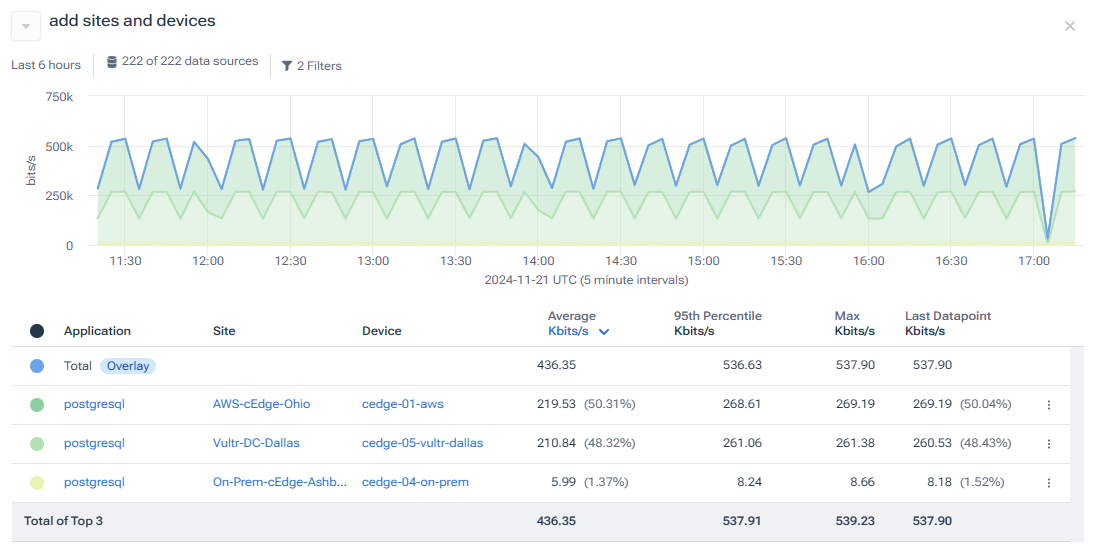
We can now see that the majority of the traffic is going between Sites 1 and 5 using the devices cedge-01 and cegde-05.
Step 4
Next, let’s also include destination interfaces in the query to see over which interfaces this traffic goes.
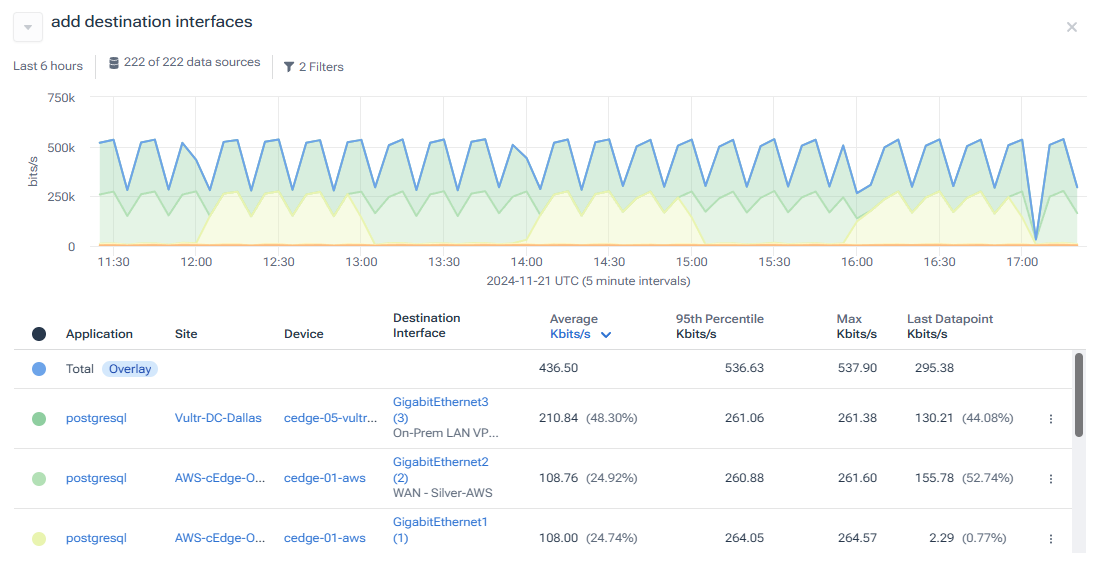
The results show that the cedge-01 device periodically switches the outgoing traffic between two WAN interfaces. This might explain why users were experiencing intermittent application connection problems. But we still don’t know what might have caused it yet. SD-WAN technology dynamically routes traffic based on conditions like interface utilization, packet loss, latency, and jitter. So, let’s look at some of those metrics to see why this rerouting might occur.
Let’s start by asking about the outbound bitrate for these WAN interfaces.
Step 5
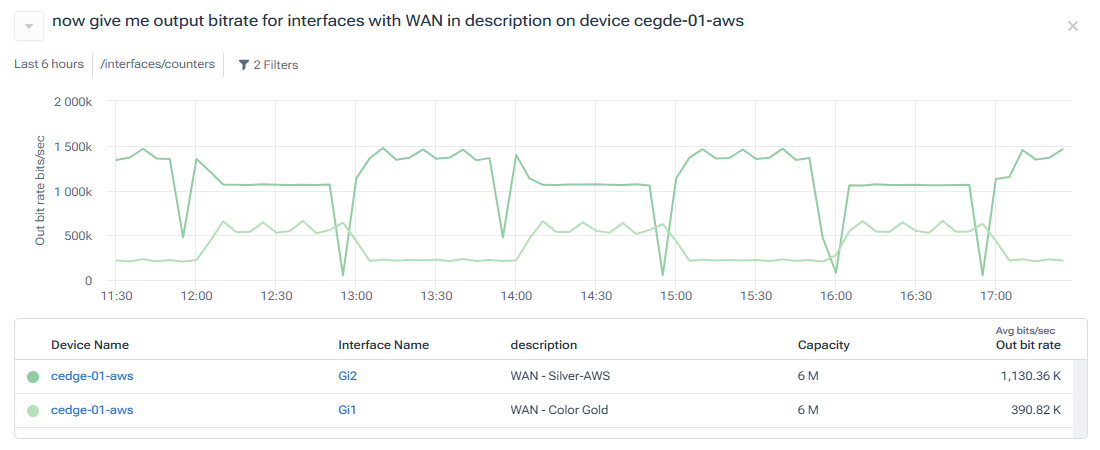
The query results show traffic patterns on these links, but with a capacity of 6 Mbps and traffic below 2 Mbps, congestion isn’t the issue.
Note: Until now, we’ve been looking at results from Data Explorer queries. This one is showing us metrics from Metrics Explorer instead. Journeys allows us to seamlessly query data from across Kentik, keeping relevant filters and devices in context.
Since it doesn’t look like congestion is the issue, let’s check in on the device’s health by asking to see general metrics on the device.
Step 6
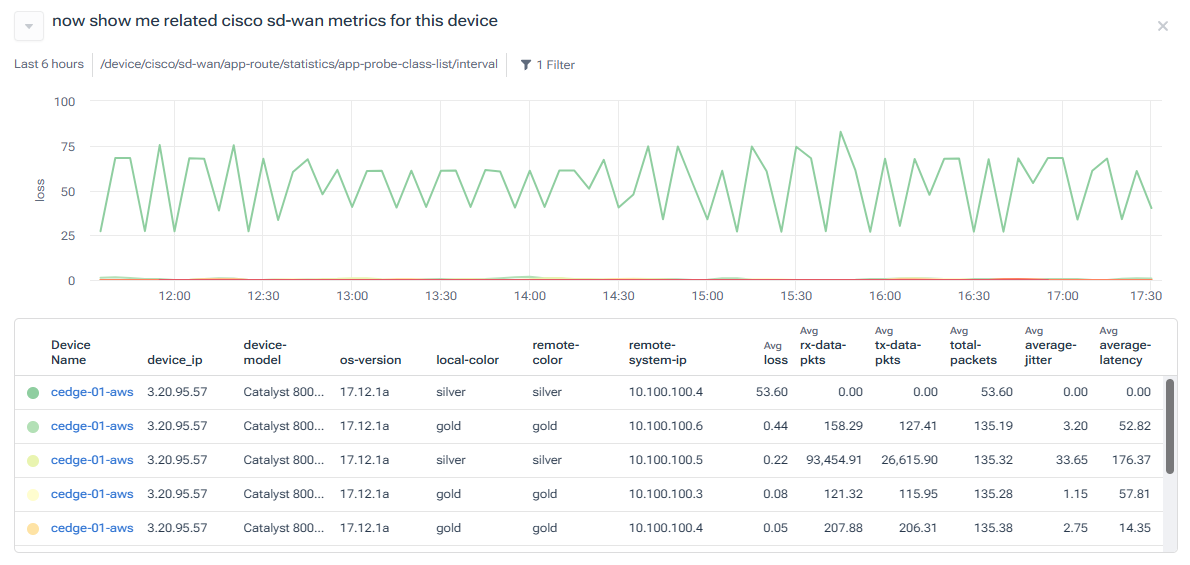
The results include a chart with packet loss metrics on the silver link towards Site 4, which isn’t our focus. However, the table also reveals metrics for silver and gold links to Site 5. We can see a lot of traffic on these links, but the silver link also shows a higher average jitter and latency than the gold link.
Let’s look at this a little more closely.
Step 7

The results show that there is an increased latency on this link, which periodically jumps to about 300 milliseconds, likely causing the PostgreSQL traffic to reroute.
Now, because these graphs are time-normalized, we can quickly look and compare this latency against the traffic switching pattern we looked at earlier:
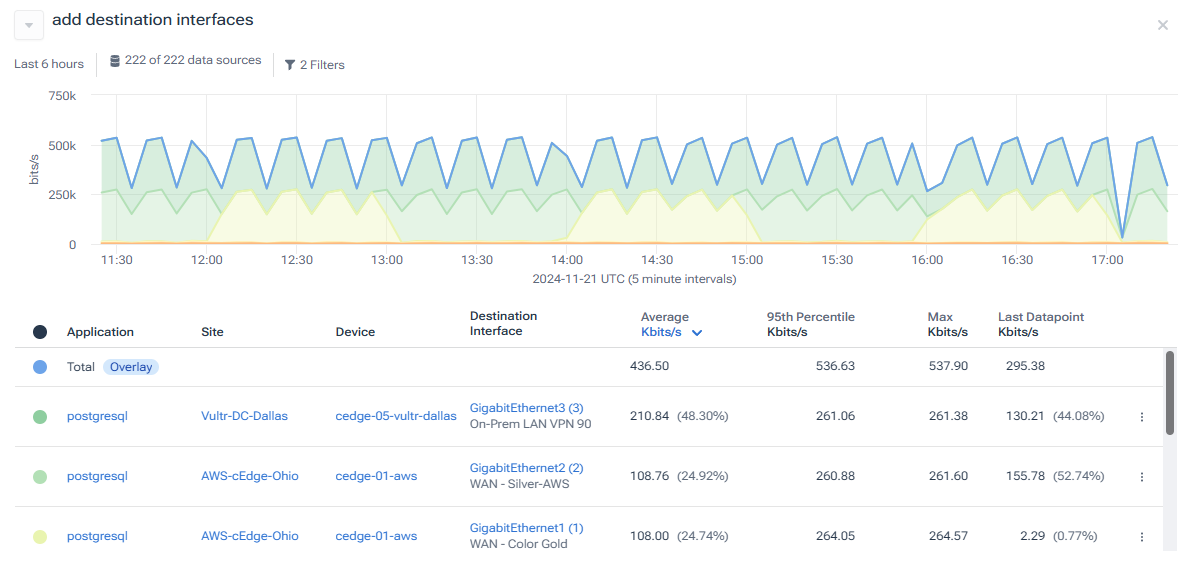
We can see that traffic goes through the silver link when the latency is normal. But when the latency on the silver link increases, the traffic is routed through the gold link.
This makes sense as it is the expected behavior based on our routing policies on the Cisco SD-WAN controller. With Kentik, we’ve confirmed that SD-WAN routing policies function correctly, but our connectivity service provider needs to address the periodic link quality degradation.
Faster root cause analysis using natural language
Being able to troubleshoot a network problem, especially one that stems from intermittent network activity, means analyzing data about devices, application flows, user behavior, service provider information, and more. In other words, to get to the answer, it takes a lot of time and effort to mine through data, look for clues, ask questions, and draw conclusions. It’s an iterative process that isn’t always linear.
Journeys brings the power of AI and natural language to this process, eliminating the need to manually go through multiple menus, filters, and mine charts. It also makes it easier for non-routine users to use Kentik to start diagnosing issues and to provide an easy-to-reference process to reflect on and see what you’ve already done if you need to change thought process or direction.
Want to give Journeys a try? You can try Kentik for free for 30 days.
