Summary
With BGP and NetFlow correlated into a unified datastore, Kentik Detect’s advanced analytics provide valuable insights for both engineering and sales. In this post we look into a fairly recent addition to Kentik Detect, Route Traffic Analytics. Especially useful for capacity planners and peering coordinators, RTA makes it easy to see how many unique routes are represented in a given percent of your traffic, which indicates the route capacity needed in your edge routers.
Using Kentik Detect Analytics to Optimize Network Design
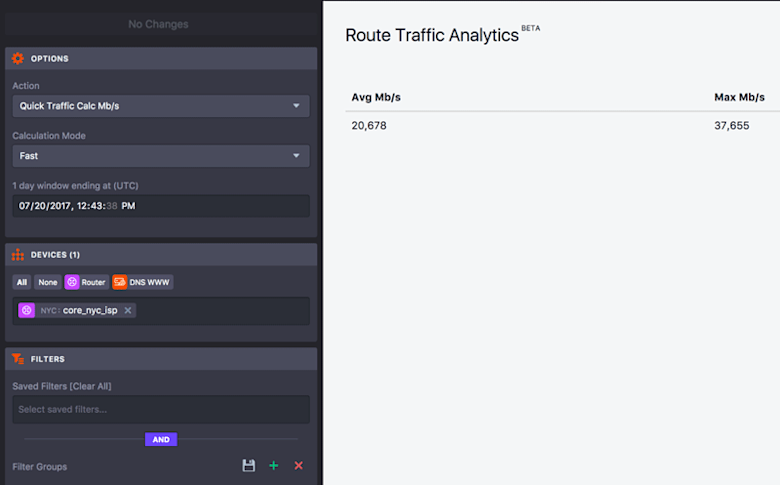
In a previous post, we looked at how Peering Analytics in the Kentik Detect portal allows you to visualize the traffic leaving your network by geography, site, or BGP AS path. In this post, we’ll look at another analytics feature, namely Route Traffic Analytics. Like Peering Analytics, RTA is useful to Capacity Planners and Peering Coordinators. It evaluates flow and BGP data to derive the distribution of traffic across routes, allowing you to see how many unique network prefixes (routes) are represented in a given percent of your traffic. That tells you which routes you need to have in your IP forwarding table (a.k.a. Forwarding Information Base, FIB, or CEF) to cover a given percentage of your traffic. Pretty awesome stuff! To access Route Traffic Analytics, go to Analytics » Route Traffic, where you’ll see a quick summary of total traffic for the last 24 hours on the device that’s currently selected in the Devices pane of the sidebar. The average and maximum Mb/s numbers are the same numbers you would get in the Data Explorer if you ran a query for total traffic on this device for the last 1 day.

Route Distribution
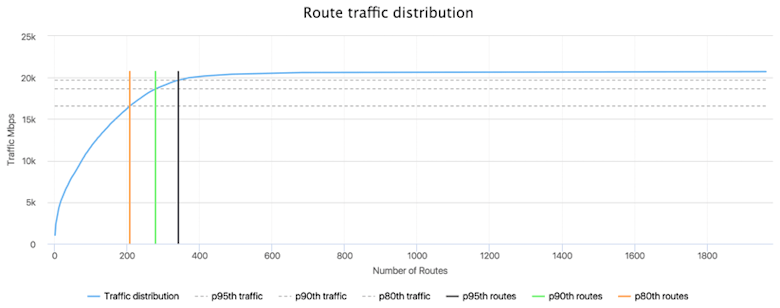
The quick traffic calculation is interesting as far as it goes, but let’s dig in a little more. In the sidebar’s Options pane, click the drop-down Action menu and choose Summary. You can also change which devices and 24-hour time-range you look at. Don’t forget to apply your changes with the big green button at the top. This should return a graph showing your route traffic distribution.

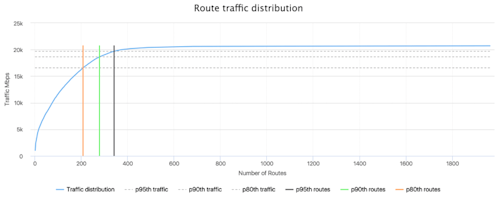
What is this graph telling us? On the left (Y-axis) we have the traffic in Mbps and on the bottom (X-axis) we have the number of routes in the forwarding table. As the number of routes increases, we see a corresponding increase in total traffic (plotted with the blue line). We also have lines for 80th, 90th, and 95th percentile. The dashed horizontal lines represent the traffic for each percentile. The colored vertical lines represent the number of routes for each percentile. This allows us to see at a pretty quick glance how many routes cover how much of our traffic. In addition to the graph there is also a table that gives further information about the same underlying data.

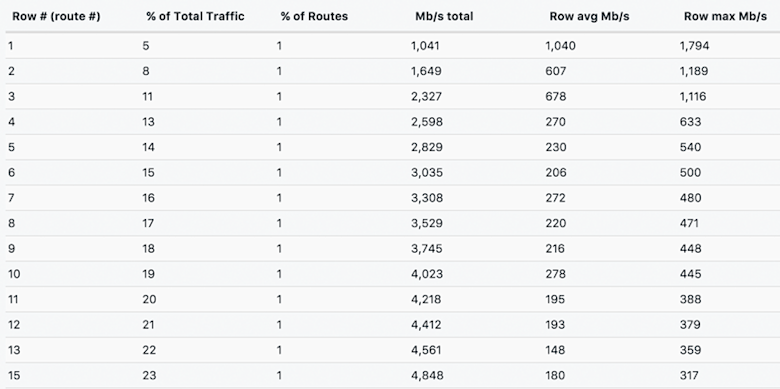
As you can see, each row represents traffic (over the selected 24-hour window) for a given route. The row tells us the percentage of overall traffic the route represents as well as that route’s average and maximum Mbps. It also shows the percentage of the forwarding table that is covered up to this row, and the cumulative average Mbps of all routes up to this row.
Top 1000 routes
Once you are done digesting the route distribution summary, let’s dig a bit deeper. Back on the Action menu, select Top 1000 Routes, then click Apply Changes. You should then see a table that looks something like the following.

So what is this telling us? Each row in the table gives us a set of details (representing a 24-hour period) for a given route, including average Mbps, Maximum Mbps, and total cumulative average Mbps of this route plus the ones above it. It also shows the percent of overall traffic this route represents, the percentage of your forwarding table covered up to this row, the number and name of the route’s destination AS, and the route’s destination country code.
How Route Traffic Analytics Helps
In a previous life I worked at a hardware vendor, and if I’d had access to this kind of information I could have used it all the time. Best practices in network design traditionally dictated that an edge router must be able to hold a full BGP route table, and as the size of the global BGP route table exploded, so too did the memory requirements for those routers. As forwarding table size became one of the biggest cost drivers for routers, customers often wanted to know if they really needed an expensive router or if they could get away with a cheaper switch.
The question is still valid today: do you really need a full BGP route table in your device? What if you deployed a lower cost switch that could store only a partial table? How many routes do you really need? The fact is that if you can cover 99% of your traffic with a few thousand routes, you can just get a default route for the other 1% of your traffic. Most modern switches can handle 128k routes with no issue. That could equate to huge savings on the type of device you deploy at the edge of your network. For more information on “Lean FIB”, check out this blog post from Fastly.
Once we’ve analyzed our route table and figured out what we need to know, we still might like to be able to dump this data to a CSV file so we can analyze it further. No problem! Go back to the Action menu, choose Export Top Routes As CSV, and then Apply Changes. You’ll now see a link in the main display area that you can click on to download the Top 1000 routes data as a CSV file.
Does all this Route Traffic Analytics talk leave you eager to unlock the knowledge hiding in your routing table? Request a demo of Kentik Detect, or start a free trial today. If you’re already a Kentik Detect user, you’ll find more detailed information on the Analytics features in our Knowledge Base. Or contact support for further assistance.
