Summary
The network data collected by Kentik Detect isn’t limited to portal-only access; it can also be queried via SQL client or using Kentik’s RESTful APIs. In this how-to, we look how service providers can use our Data Explorer API to integrate traffic graphs into a customer portal, creating added-value content that can differentiate a provider from its competitors while keeping customers committed and engaged.
Using the Data Explorer API for Added-value Content
Kentik Detect™ is a powerful solution that ingests and stores large volumes of network data on a per device, per customer basis. The data is stored in the Kentik Data Engine™, a timeseries database that unifies flow records (NetFlow v5/9, IPFIX, sFlow) with BGP, Geo-IP, and SNMP. Information stored in KDE can be utilized for a variety of use cases, including network traffic engineering, Distributed Denial of Service (DDoS) detection, BGP traffic analytics, network planning, and infrastructure security monitoring. Kentik Detect subscribers have full access to this data via the easy-to-use Kentik Detect portal as well as any PostgreSQL-capable client. In addition, one of the unique features of Kentik Detect is the ability to access stored data directly through one of Kentik’s open RESTful APIs.
Kentik APIs enable programmatic access to KDE-stored data for a variety of purposes, including integration with existing network monitoring tools, backend datastore integration, and augmentation of customer portals. In this piece we’ll focus specifically on that last use case. Service providers may use a visually pleasing customer portal as an upsell to existing services, a way to attract new customers, or a means to reduce customer churn. The data stored in KDE can serve as the basis for graphs and tables that represent customer network traffic, and service providers can draw on that data to provide an interesting, attractive enhancement to their customers’ portals. The key to making that work is Kentik’s Data Explorer API.
Note that what follows here is not intended as an HTML or PHP programming guide; the reader is expected to understand Web server security, API authentication, and customer portal development. With that in mind, this document can serve as a general framework for understanding the different options, arrays, and general structure that should be used with the Data Explorer API.
About the Data Explorer API
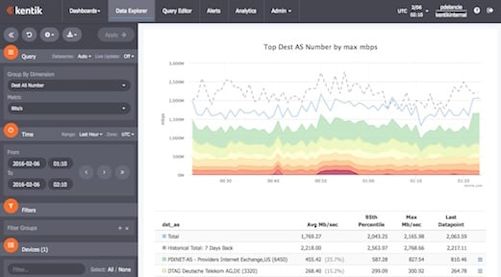
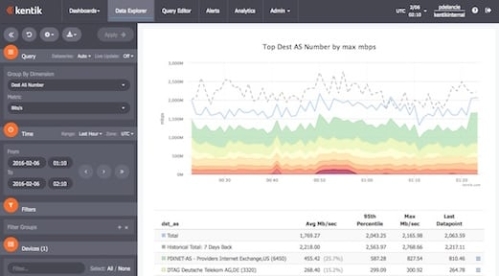
The Data Explorer API models the functionality of the Data Explorer in the Kentik portal (pictured at right), allowing data in the KDE to be queried and for results to be returned in one of three forms:
- Timeseries graph: the data for an image (JPG, PDF, PNG, or SVG) of a graph that is a visualization of query results, similar to what is seen in the Data Explorer.
- TimeSeries data: the data used to generate time-series graphs in Data Explorer.
- Top-X data: raw JSON like the data used to generate the tables that are displayed in Data Explorer.
The API supports the same querying options that are available in the Data Explorer, including group-by dimension, metric, time-range, filters, and devices. Service providers can also choose how customer data is displayed, including options such as stacked or line view, and whether history or 95th percentile is plotted.
The data associated with individual customers can be differentiated using tags that are defined either in the Admin section of the portal (see Tag Settings) or using the Tag API in the Kentik V1 APIs. Tags can be defined based on a number of configuration parameters, including interface description (regex can be used to pull a portion of the name), IP addresses and subnets, device name, and ASN. Tags are applied as network data is ingested into KDE, with source or destination flow records each evaluated independently for matches. In the Data Explorer API, the tags to match in the query are passed in as filter settings.
Laying the foundation
In the explanation below we’ll be looking at using the Data Explorer API to generate timeseries graphs with PHP. Before we dig into the details of the PHP code that addresses the API, let’s look at the building blocks that you’ll need to put in place:
- Tags: In the Kentik Detect portal, go to the Add Tags page (Admin » Tags) to create tags that can be used to distinguish between customers.
- Test directory: Create a new folder on the Web server (e.g. http://your_domain.com/test/) and be sure to check ownership and permissions.
- Script file: Paste the PHP script covered in the next section into a file called “welcome.php” and put it into the test directory.
- Customer login page: Create a basic customer login page that includes a request for the company name. This will define the customer tag passed in the filterValue option of the API’s query object so that the traffic of the requesting customer’s can be distinguished from the traffic of other customers. To differentiate between inbound and outbound customer traffic, pass tags in the value of the src_flow_tags and/or dst_flow_tags filterField (see filterSettings Object).
- HTML form: On the page that customers go to after logging in, create an HTML form to request information from your customer. The group-by dimensions, metrics, units, and lookback_seconds are typical options available for customer selection. To determine what metrics and units to include, reference the query object documentation defined in the Kentik Knowledge Base.
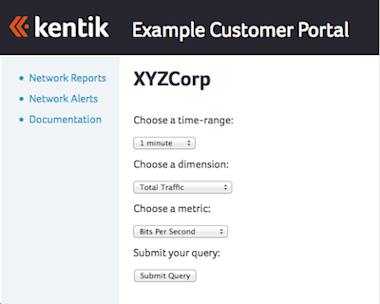
The following example shows a basic HTML form for capturing a query request in a customer portal. This simple form would allow a customer to select the time-range to cover in the query, the dimension to plot in the graph, and the metric (units) in which the traffic should be measured:
<div id="section">
  <b id="welcome">Enter a query:</b>
  <form action="welcome.php" ; method="post">
    <input type="text" name="company" readonly value="<?php echo $_POST["company"];?>" /><br>
    Choose a time-range:<br>
    <select name="TimeRange">
      <option value="900">15 minute</option>
      <option value="3600">1 hour</option>
      <option value="21600">6 hour</option>
      <option value="86400">1 day</option>
      <option value="604800">1 week</option>
    </select><br>
    Choose a dimension:<br>
    <select name="ReportAttribute">
      <option value="Traffic">Total Traffic</option>
      <option value="Geography_src">Source Country</option>
      <option value="src_geo_city">Source City</option>
      <option value="ASTopTalkers">AS Top Talkers</option>
      <option value="PortPortTalkers">Top L4 Ports</option>
      <option value="TopFlowsIP">Top IP Flows</option>
      <option value="IP_src">Top Source IPs</option>
      <option value="IP_dst">Top Destination IPs</option>
    </select><br>
    Choose a metric:<br>
    <select name="Units">
      <option value="bytes">Bits Per Second</option>
      <option value="packets">Packets Per Second</option>
      <option value="unique_src_ip">Unique Source IPs</option>
    </select><br>
    Submit your query:<br>
    <input type="submit">
  </form>
</div>
Scripting the request
Now we’re ready to look at code that handles the form input, makes a request to the KDE via the timeSeriesGraph endpoint of the Data Explorer API, and returns (in an HTTP response body) the binary data for an image of a graph. A script to pass REST API parameters can be in PHP, JavaScript, or Python.
For basic testing and understanding you can use the PHP script provided below. We’ll look at the script in detail in the following section. Note that the API-token and API-email should be hidden from the customer, which it is not in this example.
This script queries outbound traffic and uses source flow tags. The script uses curl_setopt to define the HTTP POST request and format it in JSON:
<?php
  $ch = curl_init();
  $fields = array(
    'imageType'=>'image/svg+xml',
    'width'=>'1200',
    'query'=>array(
      'device_name'=>'all_devices',
      'metric'=>urlencode($_POST['ReportAttribute']),
      'units'=>urlencode($_POST['Units']),
      'time_type'=>'relative',
      'lookback_seconds'=>((int)$_POST['TimeRange']),
      'query_title'=>($_POST['ReportAttribute']),
      'sub_title'=>'outbound'),
      'filterSettings'=>array(
        'connector'=>'All',
        'custom'=>'false',
        'filterString'=>'',
        'filterGroups'=>array([
          'connector'=>'All',
          'filterString'=>'',
          'filters'=>array([
            'filterField'=>'src_flow_tags',
            'operator'=>'ILIKE',
            'filterValue'=>($_POST['company'])
          ])
        ])
      )
    )
  );
  $header = array('Content-Type: application/json','X-CH-Auth-Api-Token:','X-CH-Auth-Email: ');
  $data_string = json_encode($fields);
  $postvars = '';
  $url = "https://api.kentik.com/api/v4/dataExplorer/timeSeriesGraph";
  curl_setopt($ch, CURLOPT_CUSTOMREQUEST, "POST");
  curl_setopt($ch, CURLOPT_HTTPHEADER, $header);
  curl_setopt($ch, CURLOPT_URL, $url);
  curl_setopt($ch, CURLOPT_POSTFIELDS, $data_string);
  curl_setopt($ch, CURLOPT_RETURNTRANSFER, true);
  curl_setopt($ch, CURLOPT_CONNECTTIMEOUT, 3);
  curl_setopt($ch, CURLOPT_TIMEOUT, 20);
  $image = curl_exec($ch);
  curl_close ($ch);
  print_r($image);
?>
The script above can be modified to look at inbound traffic instead by making the following two changes:
- Change sub_title to “Inbound.”
- Change filterField to “src_flow_tags.”
A closer look
Now let’s look closer at certain elements of the script for greater detail.
'imageType'=>'image/svg+xml',The image type is passed to tell the system how to render the image. Service providers can choose between any of the following options:
- SVG: image/svg+xml,
- PDF: application/pdf
- PNG: image/png
- JPG: image/jpeg
'width'=>'1200',The width of the image can be defined for formats other than SVG.
    'query'=>array(
      'device_name'=>'all_devices',
      'metric'=>urlencode($_POST['ReportAttribute']),
      'units'=>urlencode($_POST['Units']),
      'time_type'=>'relative',
      'lookback_seconds'=>((int)$_POST['TimeRange']),
      'query_title'=>($_POST['ReportAttribute']),
      'sub_title'=>'outbound'),
      'filterSettings'=>array(>
        'connector'=>'All',
        'custom'=>'false',
        'filterString'=>'',
        'filterGroups'=>array([
          'connector'=>'All',
          'filterString'=>'',
          'filters'=>array([
            'filterField'=>'src_flow_tags',
            'operator'=>'ILIKE',
            'filterValue'=>($_POST['company'])
          ])
        ])
      )
    )
The query object is one of the most important objects because it tells the interpreter what information the customer wants to see graphed. The query object includes a variety of fields whose values can either be preset by the provider or presented to the customer for input in the HTML form:
- device_name: in most cases this will be all_devices (routers and hosts), but it could also be a comma-delimited list of individual devices.
- metric: this represents the group-by dimension and wood most likely be customer-selected.
- units: another value that would most likely be customer-selected. Options include bps, pps, flows/s, unique-source-ips, and unique-destination-ips. If the service provider is using the host agent (host-nprobe-basic), other units can be included such as latency, retransmits, out-of-order packets, and fragment data.
- time_type: the time range can be a fixed at a specified time or relative to the current time.
- lookback_seconds: If time_type is relative, service providers can define the duration of the time-range covered by the query.
- viz_type: the graph type, either stacked area chart (default) or line chart.
- show_overlay: a Boolean that specifies whether a history line is included in the graph.
- filterField: part of filterSettings, this field defines the customer tag that enable differentiation between customers. If service providers want to show both inbound and outbound traffic, two separate REST calls will be needed to reference src_flow_tags and dst_flow_tags.
- filterValue: the provider’s unique customer identifier, taken from the customer’s portal login.
$header = array('Content-Type: application/json','X-CH-Auth-Api-Token:','X-CH-Auth-Email: ');The HTTP header needs to include the API token and API-email, both of which can be found on the Kentik portal for your (provider) user account. This information must be protected by the service provider and hidden from individual customers.
$data_string = json_encode($fields);The REST API call will need to be JSON encoded.
$url = "https://api.kentik.com/api/v4/dataExplorer/timeSeriesGraph";The URL string passes the path for the REST call, including the endpoint, which in this case is set to timeSeriesGraph to return image file data. As mentioned above, the other available endpoints are timeSeriesData and topXData.
Final results
When the customer submits the query from a customer portal that uses the example PHP above, a JSON-encoded HTTP POST message will be generated and sent to the KDE via the Data Explorer API, and an SVG image will be returned on a separate HTML page similar to the following sample output, which shows a line chart of top outbound flows by Layer 4 port (port-to-port talkers) as measured in bits/second:
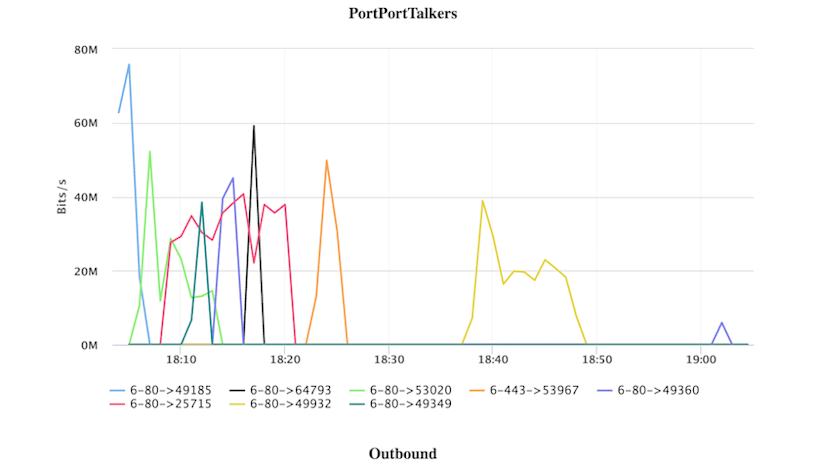
Part of the beauty of the Data Explorer API is that it corresponds closely to the Data Explorer itself, so you can play with options in the portal to see the effect of different parameter values in the API. The following image, for example, shows top inbound flows by Layer 4 port as measured in bits/second, this time as a stacked area chart that includes a dashed line for history:
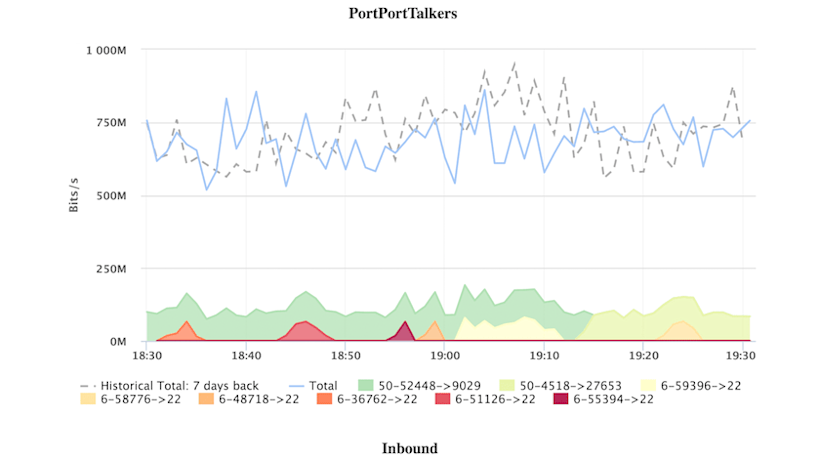
As you can see from the above, the Data Explorer API can be a powerful tool for creating added-value content that can be instantiated into customer portals. Providing informative customer-specific graphs isn’t just about making the customer portal more interesting and attractive; by giving customers greater insight into the traffic over their networks, the Data Explorer API becomes part of the toolset that providers can use to differentiate themselves from competitors while keeping customers committed and engaged. If you’d like to learn more about how Kentik integration can add value to your customer portal, contact us at sales@kentik.com (existing Kentik customers please contact support@kentik.com).
