Kentik Detect Alerting: Configuring Alert Policies
Summary
Operating a network means staying on top of constant changes in traffic patterns. With legacy network monitoring tools, you often can’t see these changes as they happen. Instead you need a comprehensive visibility solution that includes real-time anomaly detection. Kentik Detect fits the bill with a policy-based alerting system that continuously evaluates incoming flow data. This post provides an overview of system features and configuration.
Deep, Powerful Anomaly Detection to Protect Your Network
One of the most challenging aspects of operating a network is that traffic patterns are constantly changing. If you’re using legacy network monitoring tools, you often won’t realize that something has changed until a customer or user complains. To stay on top of these changes, you need a comprehensive network visibility solution that includes real-time anomaly detection. Kentik Detect fits the bill with a policy-based alerting system that lets you define multiple sets of conditions — from broad and simple to narrow and/or complex — that are used to continuously evaluate incoming flow data for matches that trigger notifications. The power of Kentik Detect’s alerting system — offering a field-proven 30 percent improvement in catching attacks — comes from the processing capabilities of Kentik’s scale-out big data backend combined with an exceptionally feature-rich user interface. In this blog post we’ll look at the basics of configuring this system to keep your team up to date on traffic that deviates from baselines or absolute norms. In future posts we’ll explore particular capabilities and use cases of the system, and how to harness its power for better network operations.
Kentik Alert Library
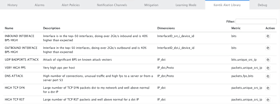
The first thing to know is that you don’t have to master the configuration of alert policies from scratch. Kentik support is available to walk you through the configuration process, and we’ve also provided an extensive library of policy templates that cover common alerting scenarios and get you most of the way toward creating an alert policy that meets your specific needs. You’ll find these templates on the Kentik Alert Library tab of the Alerting section of the Kentik Detect portal (accessed via the Alerts menu in the navbar).
Alert Policies
The Alert Policies tab is the access point for all of the policies currently configured for your organization, and it’s also where you add new policies. To configure a template copied from the library, or to edit an existing policy, click the edit button at the right of that policy’s row in the alert policies list. To start a fresh policy, click the Create Alert Policy button at the top right of the tab. Either action will take you to an Alert Policy Settings page, which is where you’ll get down to the configuration process. The policy settings page is made up of three main sections: the title bar (with a few basic controls, e.g. save, cancel, etc.), the sidebar, and the main settings area, which is itself divided into general, historical, and threshold settings. With all of these sections, policy settings can seem pretty complicated at first, but by breaking it down we’ll be able to see the logic that gives the system its power and flexibility.
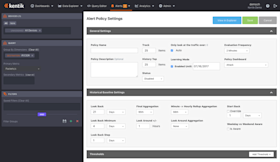
Let’s start with the sidebar, which is where you specify the metrics that a given alert will be looking at and focus the alert on a specific subset of total traffic. This gives you a lot of flexibility to define the scope of your policies so you can include or exclude only certain matches. The top pane in the sidebar is for setting the Devices whose traffic will be monitored by this policy. This pane is nearly identical to the Devices pane in Kentik Detect’s Data Explorer (see our Knowledge Base topic Explorer Device Selector), but without the Router and nProbe buttons.
Dimensions, metrics, and filters
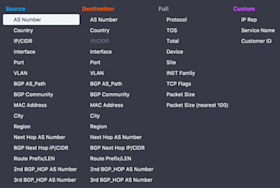
Next comes the Query pane, where you determine which aspects of ingested flow data will be evaluated for a match with the alert policy’s specified conditions. The first order of business is to define the dimensions (derived from the columns in Kentik Detect’s database) to query for data. You can choose up to 8 different dimensions simultaneously, including the IP 5-tuple, geography information, BGP, QOS, Site, and many other types of information. This lets you get very granular with the types of network traffic or conditions you want to trigger an alert on, something that’s not possible with the limited controls of legacy tools. 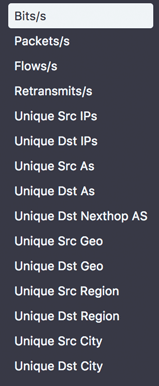
General Policy Settings
Once the sidebar panes are defined the action moves to the panes of the main settings area. The General Settings pane defines the overall settings for a policy, including the name, description, how many items to track (e.g. 10 for top-10 policies), as well as to enable/disable the alert. One noteworthy aspect of the track items setting is that you don’t have to specify which items you want to track; instead the system can automatically learn what the top-N items are and then notify you of changes to that list. For example, maybe you want to track the top 25 interfaces in your network receiving web (80/TCP) traffic and be notified if that list changes for any reason. With Kentik Detect, you can create a policy for that without having to know in advance which interfaces are your top 25. 
Historical Baseline Settings
The Historical Baseline settings allow you to configure what the current traffic patterns are compared against to see if there is a change (these settings are ignored for Static mode; see policy threshold settings below). The Look Back settings set the depth and granularity of the historical data that will be used for the baseline. The aggregation settings define how the historical data points will be calculated for comparison with current traffic. The Look Around setting is useful for traffic patterns that are hard to capture in a single 1-hour window. 
Policy Threshold Settings
The policy threshold settings define the conditions that must be met in order to trigger an alarm (which results in notifications and, optionally, mitigation). Multiple thresholds can be configured per alert policy. Each threshold is assigned a criticality (critical, major2, major, minor2, or minor) to keep them distinct based on their importance to the user. 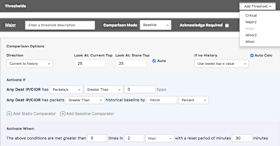
- If the direction is Current to History (default), the current dataset is primary and the comparison dataset is historical data which is derived based on the alert’s Historical Baseline settings.
- If the direction is History to Current, the historical dataset is primary and the comparison dataset is the current.
In most use cases, the default direction is the one to use. However, the History to Current setting is useful if for Top-N type policies where you want to be notified if something drops out of the top-N group. For example, we might want to know if any of the countries that are normally in our Top 10 no longer are. Meanwhile the Activate If and Activate When settings allow the user to configure the conditions that must be met, and how long they must be present, in order for the policy to trigger an alarm.
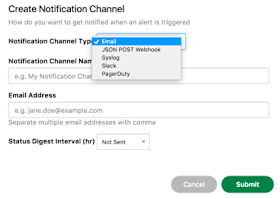
Notification Channels
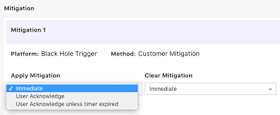
Mitigations
Summary
With a system that’s as deep and powerful as Kentik Detect, it’s difficult for an overview like this to do more than skim the surface, so we’ve covered just a few of the many capabilities available with our alerting system. If you’re already a Kentik Detect user, head on over to our Knowledge Base for more detailed information on how to configure policy-based alerts. Or contact Kentik support; we’re here to help you get up to speed as painlessly as possible. If you’re not yet a user and would like to experience first hand what Kentik Detect has to offer, request a demo or start a free trial today.


