Kentik Firehose: The Missing Piece in Full-stack Monitoring

Summary
Kentik Firehose is a way for you to export enriched network traffic data from the Kentik Network Observability Platform. With Firehose, organizations can directly integrate network data into other analytic systems, message queues, time-series databases, or data lakes.
Networks are pervasive. They provide the means for all digital communications. Although often unpretentiously represented by a single line or reduced to their famous canonic cloud bubble form, modern networks are anything but that simple.
What is called “the network” is indeed a myriad of paths between infrastructure elements, physical and virtual, dynamic and context-rich, hard to make sense of. So everything network-related is hidden in basic representations. Once all complexity is out of sight, it is easy to take the network for granted and not give a second thought to the cloud bubble or the line in the diagram, assuming that somehow everything will work out to benefit your applications and users.
The fact is that businesses cannot count on the network without paying close attention to it. Those responsible for the network need to make, and regularly revisit, smart choices, and fix problems when necessary. In the digital era, being agile is a premise, so you need clear answers fast. The time has come to bring the networks you depend on into a full Hi-Fi view.
Stakes are high for digital businesses
The digital experience became the make or break of the modern business betting on clouds, internet delivery and — with the pandemic — a distributed workforce. The bottom line is: regardless of whether you’re connecting microservices in a cloud-native architecture, workloads in hybrid deployments, or making the digital delivery path to the customer, the reliability, quality, and cost-effectiveness of the network will define the winners.
It is time to take a closer look at that cloud in your diagram and the line connecting two dots in your service map. You will see that the networks are heterogeneous. Some network infrastructure may be owned, like in your data centers and corporate WAN/SD-WAN), and others shared, like in public clouds and over the internet. Furthermore, these diverse, dynamically routed, and context-rich networks are also subject to traffic bursts, outages, degradations, and attacks. Only through data can network pros make sense, interact with, plan, and get answers in high complexity environments.
The network through the lens of data
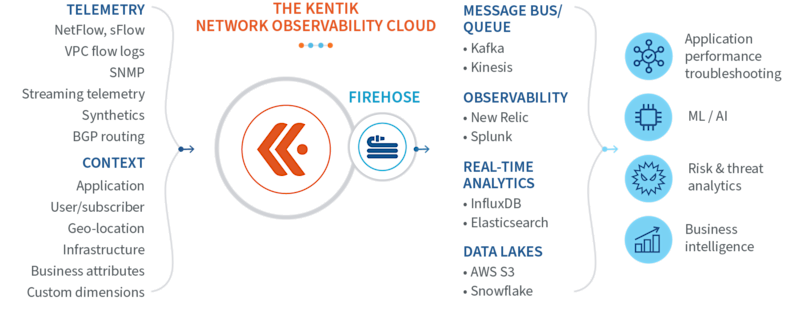
If reality shows that business success depends on highly complex networks, then network observability is a must. To observe the network, you need to collect, enrich, and analyze large, diverse, granular data sets including telemetry and events from devices, traffic flows, synthetic tests, and routing information, together with a variety of context data (e.g., business, applications, users, geolocation, threat, etc.) That is what Kentik is good at. By providing network observability, we help network pros make their networks reliable and fast — despite the odds.
What if all this network observability data could be used company-wide benefiting other teams and improving business analytics? It is now possible with Kentik Firehose.
What is Kentik Firehose?
Kentik Firehose is a way for you to export enriched network traffic data from the Kentik Network Observability Platform. With Firehose, organizations can directly integrate network data into other analytic systems, message queues, time-series databases, or data lakes. Firehose uses a client binary called KTranslate to receive data exported from our platform and perform the desired transformations to deliver the data in the format your systems can ingest, like JSON and AVRO, among others.

What you get from it
You can send unified, enriched and correlated network data to your application monitoring tool (e.g., New Relic), data sinks (e.g., Splunk, InfluxDB, Elasticsearch, AWS S3, etc.) or publishing platforms (e.g., Kafka, AWS Kinesis, Google Pub/Sub, etc.).
And what for
- Close the network observability gap in your teams’ full-stack monitoring
- Include streaming analytics and correlate network data with that of other systems to uncover new insights
- Enhance your business intelligence and predictive analytics with foundational information about traffic distribution, network reliability, and digital experience
- Extract more value from new classes of services and workflows powered by data analytics.
Closing the network gap in full-stack monitoring
While Kentik users today get answers quickly about what’s happening on the network, their counterparts from other teams are mostly in the dark, lacking critical knowledge of how the network impacts their application performance, transaction volume, customer behavior, and revenue growth, among other technical and business KPIs.
In conversations with customers and IT professionals, we often hear that observability at the network layer is missing from their application monitoring and analytics frameworks. The pain is most acute, they say, when troubleshooting application performance and some services experience high latency. Another pain point is not having insight into the performance implications and traffic costs of rolling out cloud deployments in new regions. Finally, they need network observability to validate that they are meeting the performance goals of existing services or even identify new business opportunities from their customers’ traffic profile, among other scenarios.
See more and better, do more and better
You can get almost limitless value from adding network observability to your existing intelligence. Focusing on the application and digital experience is a great start. Check out other Kentik Firehose use cases to improve application performance, troubleshooting process, workflow optimization, and business intelligence.


