Summary
Most DevOps teams use Grafana for reporting and data analysis for operational use cases spanning many monitoring systems. Grafana is a place these teams go to get answers to many questions. In this post, Kentik CTO Jonah Kowall discusses how Grafana became so popular and how the Kentik plugin for Grafana has new enhancements and features to help teams across the IT organization.
Kentik’s open platform and extensive open API architecture works for our most advanced customers to integrate data omnidirectionally with Kentik. Customers use our inbound APIs to send us various types of data, including threat feeds, DNS data, scoring data, or even physical topology data. Kentik takes this data and can correlate traffic and metric data with these additional data sources to provide additional relevance and context for customers.
Aside from feeding Kentik data, many of our customers use Kentik-enriched and summarized data to feed internal systems with a subset of the richness in the Kentik backend and user interface. These are often internal systems which collect diverse data for multiple internal teams. One such common system our customers identified early into Kentik’s creation was the heavy use of the open source product, Grafana.
Grafana’s popularity is due to the rise of many different open source time series systems, such as Prometheus for metric collection. Many, if not most, DevOps teams and others working across multiple tools use Grafana as the primary way they do reporting and analysis of data for operational use cases spanning many monitoring systems. This doesn’t mean that Grafana is the richest data source, but is a single place to go to get answers to many questions. Power users still spend most of their time in Kentik, but generalists, developers, or application-centric users spend most of their time in Grafana.
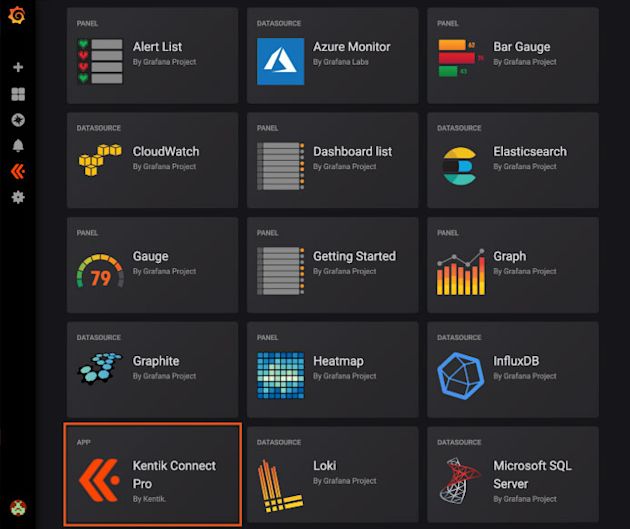
Until earlier in 2019, Grafana Labs had been developing the Kentik plugin, which was on the Grafana Connect Pro marketplace. Recently, our team took over development of the plugin used to connect the two platforms. It is now available as an open source project rather than through the Grafana Connect Pro marketplace. Since then, we’ve been busy building new enhancements and features, along with documentation of how to install the new plugin.
The new enhancements include:
- Autocompletion of metrics and filters in queries
- Automatic DNS resolution option for IP addresses in Grafana
- New installation documentation found here
- Adding webpack for a newer framework
- Performance improvements via code refactoring
- Cleaning up files and repository
- Other bug fixes and error detection
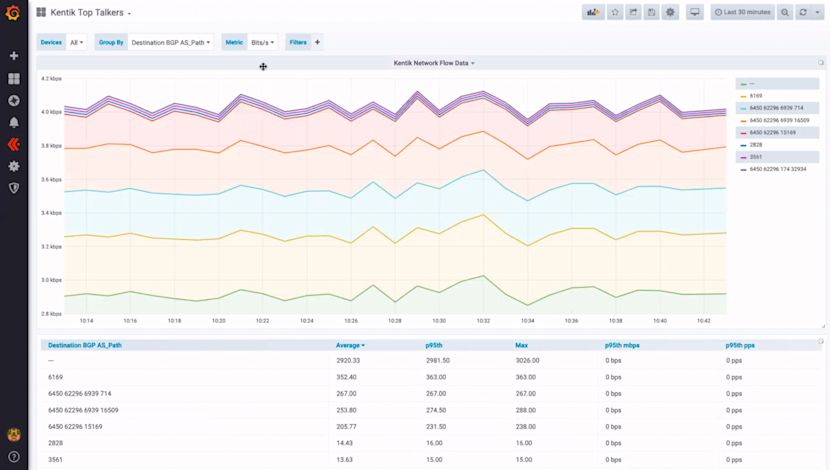
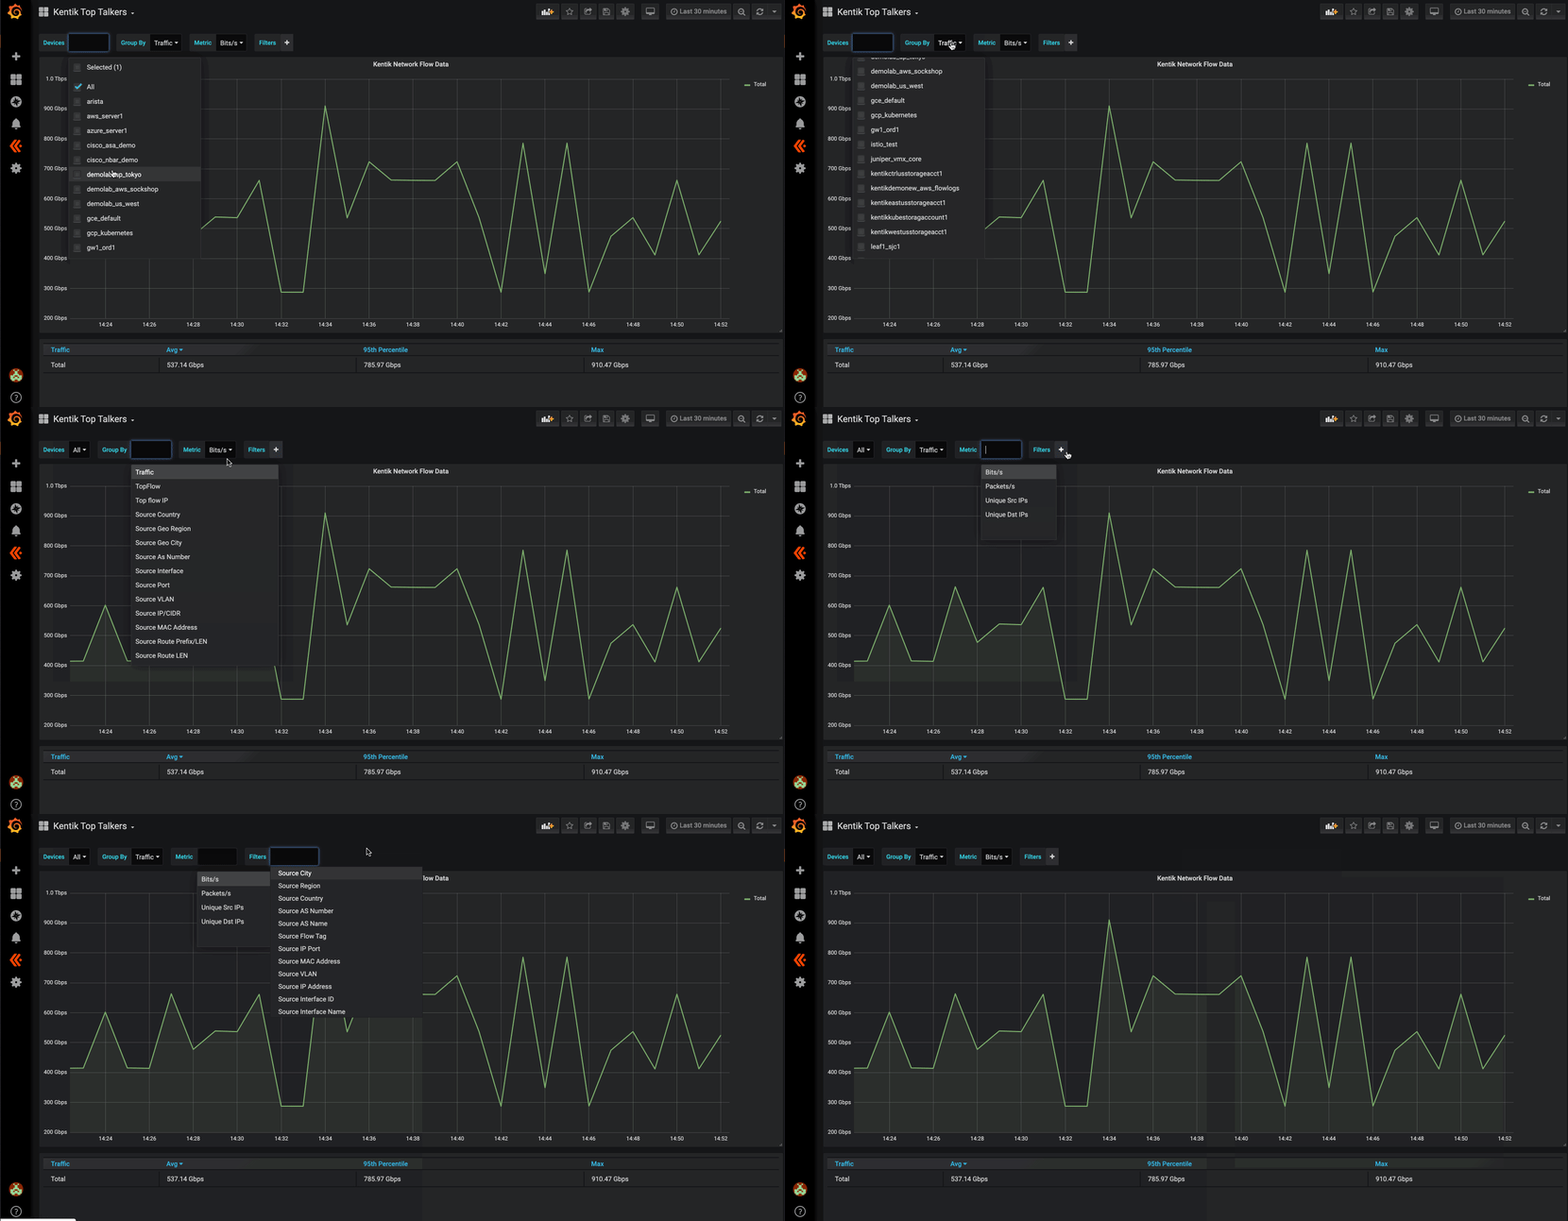
Future work includes porting the plugin to React and adding in a changelog to the plugin itself. Grafana Labs is pushing plugins towards React, so we are waiting to see how this transition goes along with keeping our eyes out for what will come in Grafana 7.0 as that is built.
Please check out Kentik’s GitHub repository, which includes streamlined install documentation. Feel free to leave feature requests or help requests as issues on GitHub. Kentik Support is also able to help, and our customer Slack channel is another great place to discuss the Grafana plugin.


