Kentik Adds Integrated Synthetic Monitoring to Deliver Next-Gen Network Observability


Summary
What is synthetic testing, and where do point solutions fail? In this blog post, Kentik Co-founder and CEO Avi Freedman discusses network performance testing and why Kentik designed an autonomous and affordable synthetic monitoring capability that is fully integrated into our network observability platform.
Digital experience drives business today, and it is the brand and storefront for your users and customers. Increasingly, digital experience is also the connector for your employees.
On top of the critical baseline of understanding what the demands and activities are on your networks, understanding the performance of the traffic flowing across your infrastructure is critical to delivering a great digital experience.
As we announced in July, Kentik released our Synthetic Monitoring offering, adding integrated, autonomous, pervasive performance testing to our already leading network traffic analytics and observability platform.
What is synthetic testing?
Synthetic testing is done by sending synthesized tests that are not from real users to check availability and performance metrics, such as latency, jitter and packet loss. Also called “active” testing in academia, synthetic testing is a way to get an idea of performance when your network elements themselves can’t passively observe it from watching your traffic. There are other ways of getting performance data, either from packets (which our cloud-native and cloud-scale customers don’t do), or by using data from up the stack to shine a light on the network, but this data is often segmented away from network teams.
Aren’t there already synthetics offerings?
Since Kentik started selling network analytics in 2015, most of our large customers have asked us to either implement or integrate with synthetics offerings. Generally, their frustrations have been around:
- Standalone systems
- Excessive manual configuration
- Noisy results due to a lack of understanding of what the network does or is doing
- The need to monitor confusing and expensive bills
My personal history with synthetics goes back to the ‘90s with Keynote. It was an expensive standalone platform full of noise, where people spent a lot of time monitoring their bills, manually setting up tests, and tuning the network to be close to the agents.
Fast-forward 25 years, and before Kentik’s Synthetic Monitoring launch, our customers tell us that the vendors they use still require manual setup and tuning, longer debug times to understand if a synthetic test failure is a problem; and spending more time monitoring bills than on maintaining the production stack!
What’s needed? An integrated, autonomous solution
For decades performance testing has been done by point solutions, which are not fully integrated, and create massive visibility and intelligence gaps. What’s worse is that these solutions waste time and effort spent on noisy alerts that have no relevance to actual traffic and also lack the context needed to validate that relevance.
In order to be effective for the modern, internet-centric and orchestrated era, a synthetic monitoring solution must have:
- No blind spots. It must monitor everything that matters by understanding the real user traffic.
- No operations overhead from manual interventions. It must avoid “stale” tests and errors in repetitive manual tasks while freeing up resources to be assigned to higher-value workflows.
- Intelligent alerts and diagnostics with less noise and more actionable insights that reduce alarm fatigue and time-to-resolution (MTTR).
- Affordable continual testing to see everything relevant, but focus in on monitoring your digital experience, not your monitoring bill.
To deliver on the promise of measuring user and employee experience, Kentik has designed an autonomous and affordable synthetic monitoring capability that is fully integrated into Kentik’s network observability platform.
Why are integration and context so key?
Knowledge of what the real traffic is and how it flows in context with the various infrastructures (e.g. internet, cloud, WAN, data centers, etc.) is fundamental. Without knowing what networks you’re depending on and their state and traffic, you have:
- The wrong tests
- Missing context that wastes valuable time on setup and interpretation
- Alert fatigue due to the lack of context and integration
- No ability to orchestrate and automate based on your important apps and customers
Autonomous and proactive
The answer? Proactive testing, set up autonomously based on your network traffic and business priorities.
As infrastructure evolves to increasingly fast and high complexity environments, automation becomes a necessity, and autonomy becomes a requirement for interaction in a timely and effective manner. At internet scale and orchestration speed, it’s simply not possible to have humans in the loop of identifying and testing all of the important aspects of your digital dependencies across cloud, SaaS, CDN, API gateways, and the service providers that connect your users and employees.
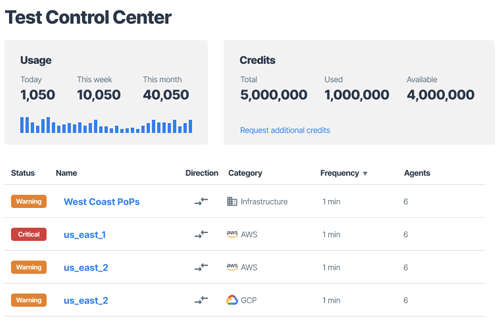
The promise of self-driving networks requires self-driving analytics, with full network context, and that’s what we’re delivering in our GA release. Kentik uses the data we have about all of the networks from you to the customer and all the telemetry types, including state, health and traffic. And then, the Kentik platform can autonomously configure tests for the things you depend on, change those tests as your application traffic shifts, and present the results in the context of impact on your users.
Autonomous configuration is also necessary to truly know about issues before your users do. Manually configuring tests after users complain puts you behind the support curve. Proactively testing your critical dependencies as traffic shifts enables you to know about – and fix – issues before users notice, and often before they’re seriously impacted.
We invite you to use Kentik Synthetic Monitoring
Kentik believes that affordable, autonomous testing integrated with network intelligence and observability is a game changer.
Kentik Synthetic Monitoring, with trillions of eyes on the global networks we see from traffic measurements observed every day, automates performance monitoring based on intent and in context with your actual traffic and the infrastructures it flows through.
Kentik monitors and alerts on what truly matters to the digital experience of your users: a fundamental leap in usability and value, designed to keep your traffic flowing smoothly and your ops teams sleeping well.
Whether you’re an enterprise or service provider, we invite you to frequently, easily and powerfully monitor your customer and team digital experience by measuring performance and availability of essential infrastructure, applications and services, including:
- SaaS solutions
- API gateways
- Applications hosted in the public cloud
- Internal applications
- Transit and peer networks
- Content delivery networks
- Streaming video, social, gaming and other content providers
- Site-to-site performance across traditional WAN and SD-WANs
- Service provider connectivity and customer SLAs
Find more information about Kentik Synthetic Monitoring and try it for yourself, or get a personalized demo with a Kentik product expert. If you have questions or comments, please email me at avi@kentik.io.


