Kentik Troubleshoots Network Performance
Summary
How does Kentik NPM help you track down network performance issues? In this post by Jim Meehan, Director of Solutions Engineering, we look at how we recently used our own NPM solution to determine if a spike in retransmits was due to network issues or a software update we’d made on our application servers. You’ll see how we ruled out the software update, and were then able to narrow the source of the issue to a specific route using BGP AS Path.
Ad-hoc data analysis answers key questions in real time
In an exciting development for Kentik, we’ve recently been recognized by IDC as a cloud monitoring innovator. The ability of Kentik Detect to offer cloud-friendly network performance monitoring — Kentik NPM — was key to the recognition we earned. In a recent blog post by Kentik Solutions Engineer Eric Graham we explained how we “dog food” our own NPM solution to troubleshoot network performance issues within our own cloud-based application. In that post, Eric shows how he found issues on a group of internal hosts that were impacting a critical microservice. Using the performance metrics from nProbe agents running on each host, we were able to identify a particular switch as the root cause.
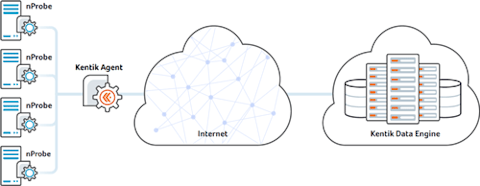
Eric’s story illustrates why our operations team continues to use nProbe and Kentik NPM on a regular basis. How does it work? Kentik NPM monitors network performance by capturing samples of live traffic with nProbe and sending the enhanced flow data to the Kentik Data Engine (KDE; Kentik’s distributed big data backend). Correlated with BGP, GeoIP, and unsummarized NetFlow from the rest of the network infrastructure, the nProbe data becomes part of a unified time-series database that can span months of network activity. You can run ad-hoc queries covering a broad variety of performance and traffic metrics — including retransmits and latency — and zoom in or out on any time range. With 95th percentile query response-time in a few seconds across billions of datapoints, Kentik NPM provides the real-time insights into performance that are needed to effectively operate a digital business.
Tracing BGP Instability
Now let’s look at another example of how we use Kentik NPM in house. After a software update on November 19th, we saw some instability in the BGP sessions from a few customer devices that feed live routing data to our Kentik Detect backend. We were concerned about whether the software update might be the source of the instability. So of course we turned to Kentik Detect to answer the age-old question: “Is it the network or the application?”
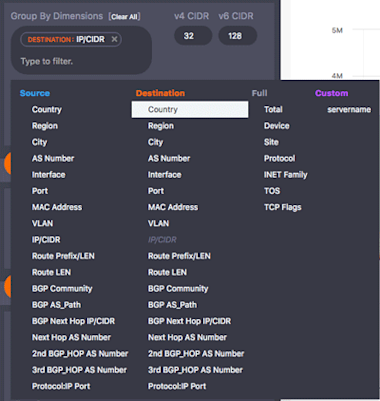
To answer that question we used a series of visualizations in the Data Explorer. For the first such visualization, we started by setting the group-by dimension in the Query pane (in the sidebar). As you can see from the image at left, Kentik Detect provides dozens of group-by dimensions, up to eight of which may be used simultaneously, which gives you many ways to pivot your analyses. In this case we chose the “Destination:IP/CIDR” dimension to frame the overall view in terms of the IPs that were the destination of the problematic traffic.
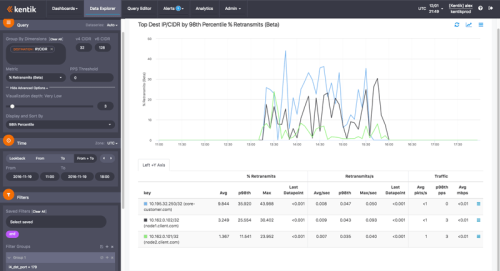
Next we set Metric (still in the Query pane) to look at the percentage of TCP retransmits. Under Advanced Options, we set the Visualization Depth to very low (so we see just the top few results) and Display and Sort By to show results by 98th percentile. In the Filters pane, we filtered to show only dest port 179 (BGP). In the Devices pane we chose any devices that could be sending traffic to the destination IPs in question. And in the Display pane we chose Time Series Line Graph. With our visualization parameters defined, we clicked the Apply Changes button. The result looked like the image below.
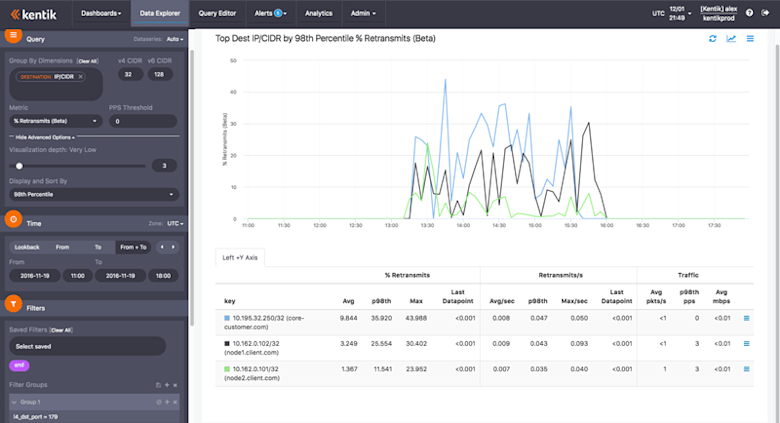
The graph and table in the main display area show us the top three destination network elements (anonymized of course) in terms of 98th percentile of retransmits of traffic using the BGP port. In the table’s “key” column (at left) we see the IP addresses of those elements along with their corresponding hostnames (also anonymized). As we move right we see the statistics about retransmits to these IPs, including percent, rate (number per second), and the traffic involved (packets and mbps). What immediately jumps out from the graph is that there is a significant spike in the percentage of retransmitted TCP packets for these three hosts. And since the network elements are at two different customers (“customer.com” and “client.com”) we can tell that it’s not a problem with just one customer’s network.
If you’re familiar with TCP/IP, you’ll know that anything above a very low percentage (anywhere from .5% to max 3% depending on the application) will be very destructive to application performance. BGP is relatively resilient to TCP retransmissions because the protocol provides a “hold timer” to keep sessions between peers alive in case keepalive messages are dropped and must be retransmitted. However, as seen in the graph above, the retransmission percentage for traffic sent to these devices was spiking to between 15% and 30% repeatedly. The result was hold-timer timeouts and persistent flaps for these BGP sessions.
Is It One of Our Servers?
With a graph like the above, it seemed highly likely that the root cause was the network. But was the issue possibly within Kentik’s own infrastructure? The next step toward finding out was to add “Full:Device” as another group-by dimension. This changes the analysis to look at the combination of the customer network element destination IP addresses and the devices exporting flow (NetFlow, IPFIX, sFlow, etc.) to Kentik. In this case, those devices are the nodes within the Kentik infrastructure that handle the BGP sessions for each customer device. All of these have nProbe deployed and are exporting network performance metrics and traffic flow details. Our next image shows the result of the revised analysis.
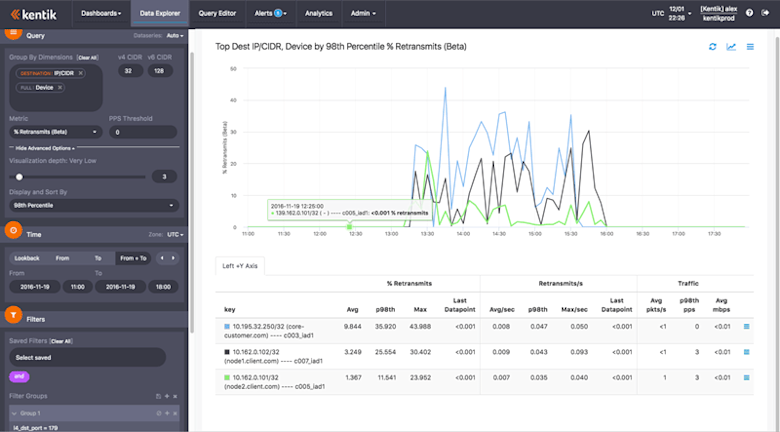
In this visualization, the key column shows the combination of the two dimensions specified in the query pane: the destination IP and hostname combined with the name of the device or Kentik node that is exporting the performance metrics. We can see that all three destination IP’s were being served by different nodes, so there was no apparent Kentik infrastructure commonality. Since there was no correlation with the servers running Kentik applications, it seemed pretty certain that the BGP issues had nothing to do with our software update.
Where in the World?
So now we had the answer to our initial question. But it was still of interest to get a better sense of where the problem was. So we pivoted our analysis by changing our group-by settings, replacing “Full:Device” with “Destination:Country”. When we re-ran the visualization we got the result shown in the image below.
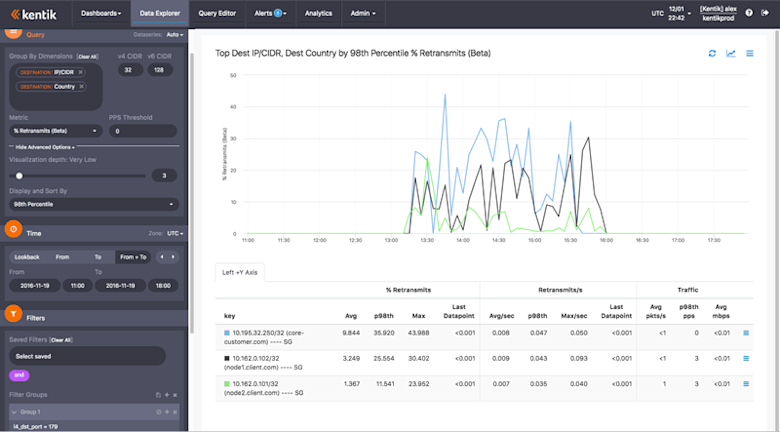
This time the key column showed the destination IP and hostname combined with the destination country, which in this case is Singapore (SG) for all three rows. So we saw a clear geographical commonality. (If we had also wanted to see if other geographies were experiencing like problems we could easily have re-run the visualization without the Destination:IP/CIDR dimension.)
Clues from AS Path
At this point, we were pretty darned certain that the root cause of the TCP retransmits was due to an issue with Internet communications, somewhere outside of our own servers. But where? We were able to find some clues by pivoting the analysis again, this time dropping destination country and including instead the dimension “Destination:BGP AS_Path.” In this latest visualization (below) the key column shows the combination of IP and hostname with the Autonomous System (AS) Path, which is a list of ASNs or Autonomous System Numbers (numerical IDs for Internet-peered networks) that indicates the path (route) taken by the traffic.
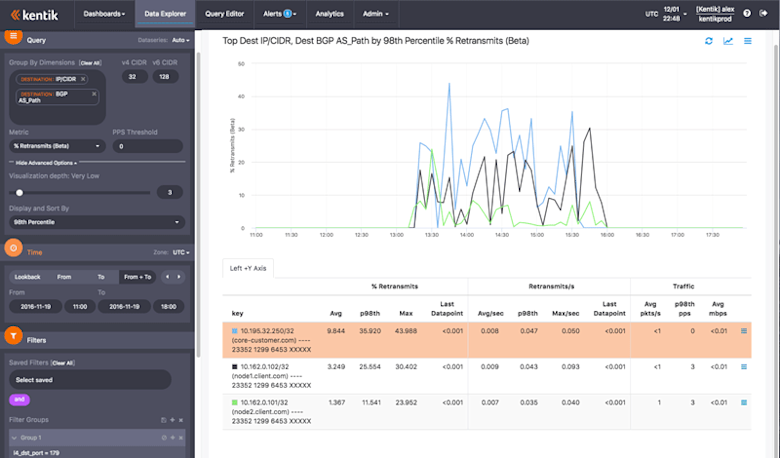
The first thing we saw was that the destination ASN — the network that the traffic ends up in and that the customer network elements are deployed in — did not present any correlation. However, the rest of the path was common. We can’t know for sure based on this analysis alone which particular “hop” in the AS Path was the problem network, though it was likely in the last few hops, as a problem earlier in the path would have affected many more customer devices. In any case, we had the confirmation we needed that the issue with TCP retransmits was not within our own network but rather due to an external root cause out on the Internet.
Precise, continuous NPM
So there you have another example of how we use Kentik NPM to monitor and troubleshoot network performance issues for our distributed, cloud-based, micro-services application. You may not be running BGP peerings, but TCP sessions are the bread and butter of communications between distributed application components, whether you’re running a three-tier web application or a massively distributed micro-services architecture. Kentik NPM allows you get precise, continuous measurement of network performance for your actual application traffic.
Learn more about applications of Kentik in Network Troubleshooting.
If you already know that you want to get your hands on a cloud-friendly network performance monitoring solution, start a free trial today.


