Summary
Migrating to public clouds initially promised cost savings, but effective management now requires a strategic approach to monitoring traffic. Kentik provides comprehensive visibility across multi-cloud environments, enabling detailed traffic analysis and custom billing reports to optimize cloud spending and make informed decisions.
Remember when the public cloud was brand new? In those days, it seemed like overnight, everyone’s strategy became to lift and shift all their on-prem workloads to public cloud and save tons of money. At that time, that just meant migrating VMs or spinning up new ones in AWS or Azure. Well, those days are pretty much gone, and we’ve learned the hard way that putting most or all our workloads in the public cloud does not always mean cost savings.
The thing is, there’s still an incredible benefit to hosting workloads in AWS, Azure, Google Cloud, Oracle Cloud, etc. So today, rather than lift and shift, we have to be more strategic in what we host in the cloud, mainly because many of our workloads are distributed among multiple cloud regions and providers.
Cloud billing is generally tied to the amount of traffic exiting a cloud, so the problem we face today isn’t necessarily deciding between on-prem hardware and hosted services but figuring out what traffic is going where after those workloads are up and running.
In other words, to understand and control our cloud costs, we have to be diligent about monitoring how workloads communicate with each other across clouds and with our resources on-premises.
Cloud optimization is crucial to delivering software with lean infrastructure operating margins and enhanced customer experiences.
Managing cloud cost
Most organizations have IT budgets with line items for software and hardware vendors, including recurring licensing and public cloud costs. A normal part of IT management today is establishing clear budget parameters, monitoring resources (especially idle resources), setting up spending alerts, and analyzing cost anomalies to prevent financial pitfalls.
But what data can we actually use to determine which cloud resources are idle, which workloads are talking to which workloads, and what specific traffic is egressing the cloud and, therefore, incurring costs?
The best guess just isn’t good enough, so we need to look at the data.
Kentik provides comprehensive visibility across clouds and on-prem networks, giving engineers a powerful tool to explore data in several key areas. Let’s examine how Kentik helps organizations manage their cloud costs.
Comprehensive visibility
First, Kentik provides a consolidated view of multi-cloud environments, offering insights into usage and costs across AWS, Azure, Google Cloud, and Oracle Cloud from a single dashboard. Kentik monitors traffic flow between cloud resources and on-premises infrastructure, helping identify high-cost data transfers and inefficient routing.
The graphic below shows a high-level overview of active traffic among our public clouds and on-premises locations. The Kentik Map is helpful as an overview, but most elements on the screen are clickable, meaning that you can drill down into what you want to know right from here.

To focus on just one cloud, we can view the topology for that provider. Here, active traffic traverses various elements such as Direct Connects, Direct Connect Gateways, and Transit Gateways.

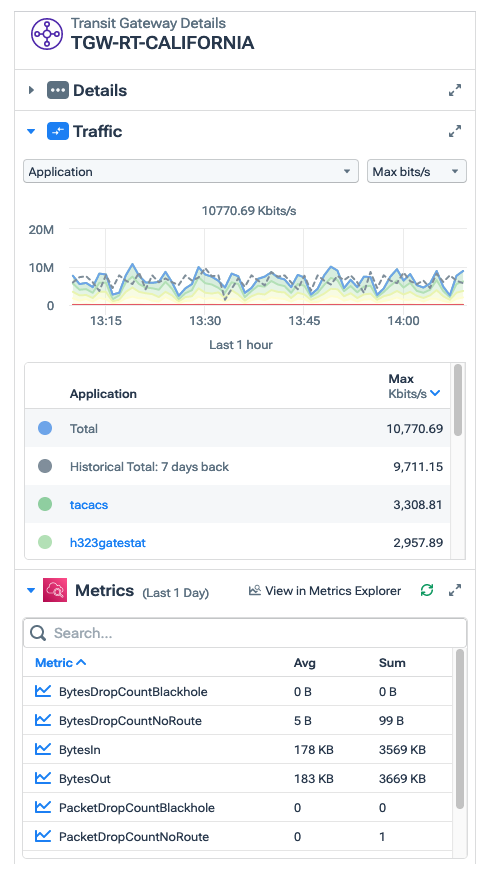
We can also open the Details pane for our Transit Gateway to get a high-level snapshot of overall traffic, which we can filter in various ways. This gets us started, but we need to get deeper when analyzing current cloud bills and trying to understand where AWS’s numbers are coming from.
Analyzing traffic to understand the cost
Data Explorer
From here, we can pivot to Data Explorer, allowing us to filter for specific data and clearly understand the traffic exiting the cloud.
Data Explorer allows an engineer to create simple or very elaborate filters to interrogate the entire underlying data in the system, including telemetry from on-premises networks and the public cloud. For example, considering most cloud costs are incurred when traffic traverses a network load balancer, NAT gateway, or ultimately some sort of internet gateway, we can set up a query that tells us what traffic and how much is leaving our public cloud region.
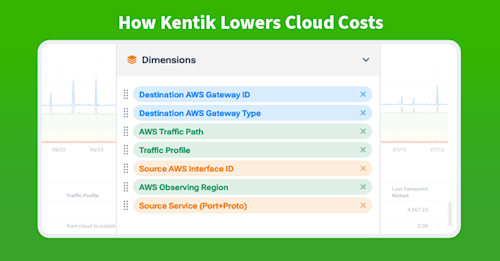
Here, we see a filter for all AWS traffic, including the destination gateway, traffic path, average traffic in bits, and max traffic.
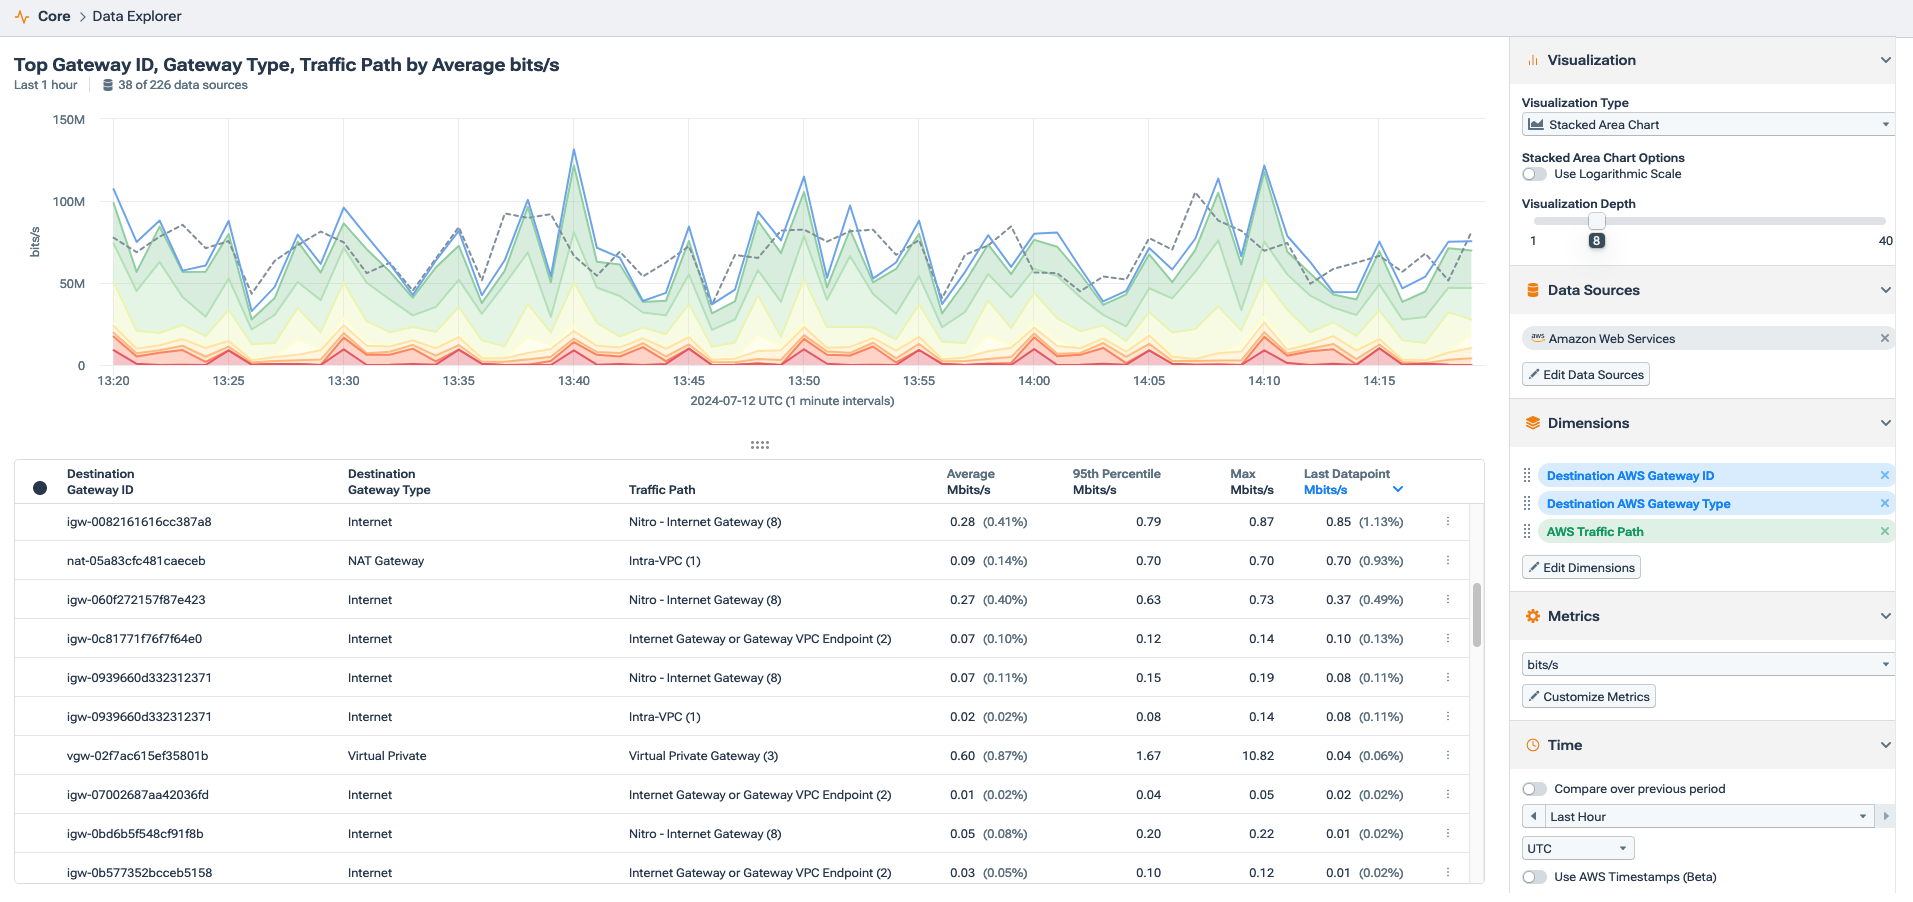
We’ll need to get more specific so we can simply add another filter option for the internet gateway and a traffic profile to identify the direction of the traffic clearly. Notice in the image below that we can see specific traffic the system identified as “cloud to outside,” which we can use as part of our filter.
Also, it’s very common for traffic to leave a public cloud only to go right back into the same cloud without technically going to the public internet. Typically, that traffic doesn’t incur a cost, so to be accurate in our cloud cost monitoring, we need to exclude that traffic, which would appear as a duplicate flow in the data.
In the graphic below, we can see the results with the expanded filter, including the removal of duplicate flows. Our metrics output is measured specifically in bits outbound (how cloud providers bill their customers) in the timeframe we care about, usually a bill cycle, and in our example, the last 30 days.

Of course, this is only an example, so you can add a specific VPC, cloud region, availability zone, or whatever is vital to your organization’s workflow.
For example, for the AWS Transit Gateway, we’re charged for the number of connections made to the Transit Gateway per hour and the amount of traffic that flows through the AWS Transit Gateway.
In this next image, we’re filtering specifically for the destination gateway type of “internet,�” which again shows us total traffic egressing our cloud instance.

Using the above information, we simply multiply the total bytes by our cost. For the US East region, that would be $0.05 per attachment and then $0.02 per GB processed by the Transit Gateway.
We can look at this data over a specific timeframe to check our billing or determine our current cost during a billing cycle. Looked at over time, we can also assess seasonality, trends, and anomalies in the traffic that directly relate to our AWS cost.
Because this method uses cloud flow logs, we can also identify applications and custom tags like customer ID, department ID, or project ID. This way, we can create billing reports right in the Kentik platform for department allocations, etc.
We can examine the source, destination, protocol, specific applications, and more to understand the main drivers of our cloud bill.

Metrics Explorer
Suppose we’re concerned with just identifying total traffic per interface. In that case, we can also use Metrics Explorer to filter for the Direct Connect, virtual interface, and even circuits that we care about. This way, we can figure out how much traffic is going across each circuit and understand if traffic is being load-balanced across them the way we want according to the cost of each circuit.
The next screenshot shows a breakdown of total outbound traffic from each Transit Gateway over the last two weeks, as well as the attachment, account, and region.

Monitoring idle resources
In addition to knowing how much and what kind of traffic is egressing our cloud instances, we also need to know what resources we’re paying for but aren’t doing anything. With Kentik, we can identify idle resources and generate reports that an IT team can use to decommission or re-allocate resources.
An easy way to do this is to filter for Logging Status to find NODATA or SKIPPED message updates.
NODATA means data has yet to be received on that ENI. Seeing the NODATA message tells us that an active ENI attached to an instance isn’t sending or receiving any data. Especially if we see this message over an extended period of time in our query, we can infer that this is an idle resource that might be able to be reallocated or shut down.
In Data Explorer, we can select Logging Status, Observing VPC and Region ID, and the flow log Account ID. We’ll change our metrics to flow data and select our timeframe of the last 30 days.
Notice that we have numerous active resources but not sending or receiving data other than the NODATA update message in our time frame.

We’re auditing data movement in and out of our public cloud instances to manage data transfers effectively, understand where our cloud bill is coming from, and, therefore, minimize cloud costs.
Managing cloud costs means understanding the data
Just like managing any budget requires understanding where our money is going, managing public cloud costs requires knowing the nature of the traffic moving through our cloud instances, specifically the various types of internet gateways.
When using a metered service like the public cloud, every egress byte represents an expense. Determining where those expenses are coming from, why they are occurring, and how they trend over time allows us to manage our cloud costs using actual data, not just a best guess.


