Multi-Cloud Made Simple: Announcing Kentik Observability Enhancements for AWS and Google Cloud


Summary
Limited visibility into network performance across multi-clouds frustrates even the best teams. That’s why we’re thrilled to announce enhanced AWS and GCP support for Kentik Cloud, enabling network, cloud, and infrastructure teams to rapidly troubleshoot and understand multi-cloud traffic.
Enterprises migrate to multi-cloud networks not because they want to, but because they have to. There’s an acquisition. An initiative to reduce costs. A mandate for redundancy.
Regardless of the catalyst (and despite a number of benefits), one outcome is always the same: limited visibility into end-to-end performance across AWS, Azure, GCP, and on-prem.
Today we are thrilled to announce updates to Kentik Cloud that enable network, cloud, and infrastructure teams to rapidly troubleshoot and understand multi-cloud traffic — and futureproof their organizations against the rising network complexity that comes with cloud adoption.
Two exciting new capabilities help you quickly answer any question about your multi-cloud network:
-
Kentik Cloud users can now collect, analyze, and visualize flow logs generated on AWS Transit Gateways. (This is in addition to cloud VPC flow logs and other Kentik data sources for cloud and hybrid environments: NetFlow, sFlow, IPFIX, J-Flow, and sFlow-RT logs.)
-
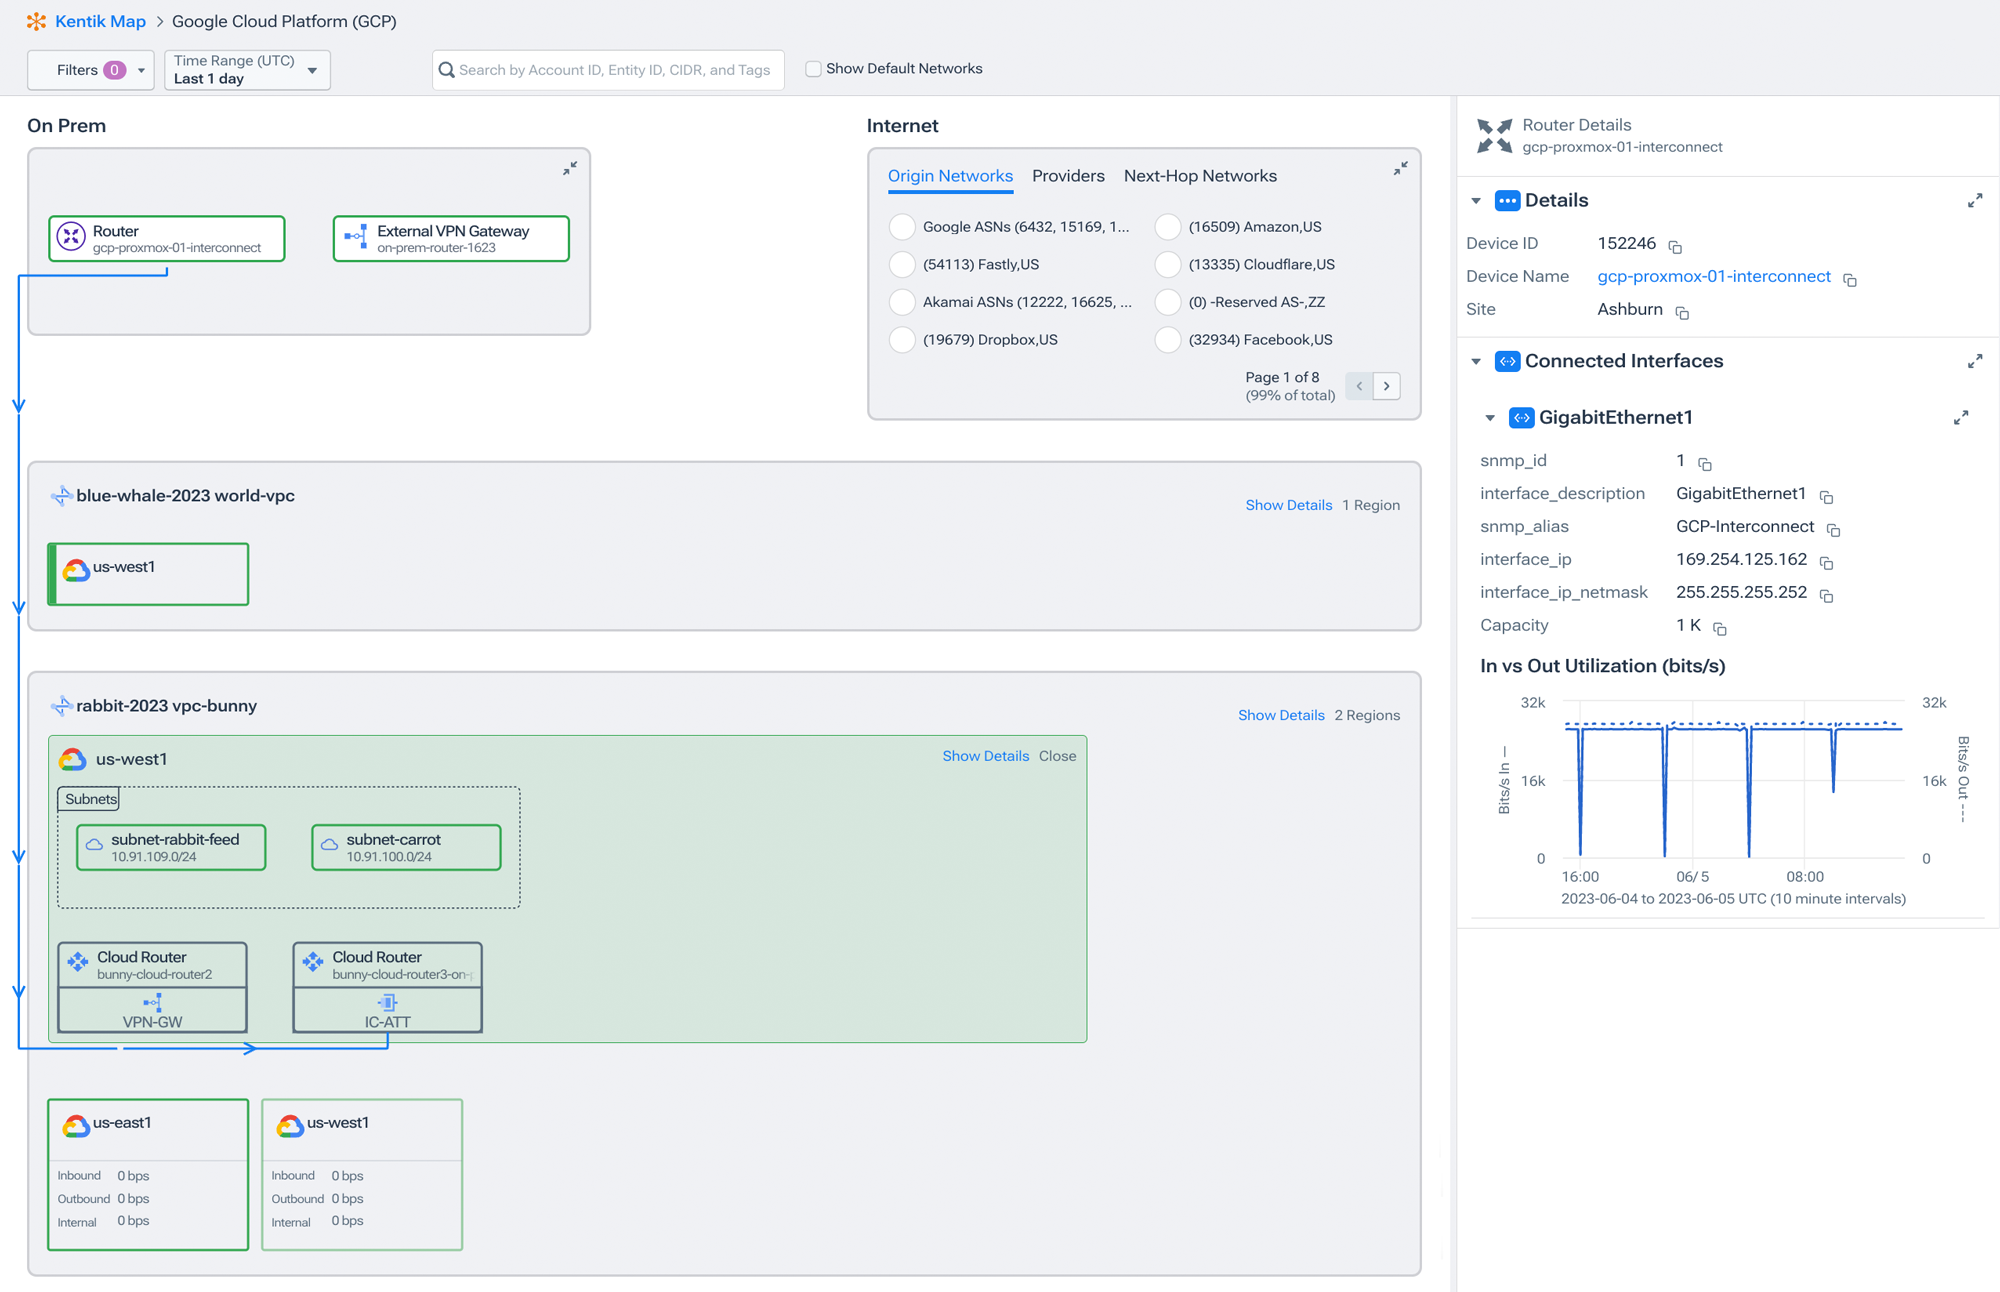
Kentik Cloud users can now access the new Kentik Map for Google Cloud to automatically visualize detailed Google Cloud and hybrid cloud infrastructure topology.

With these enhancements, Kentik Cloud enables you to monitor network traffic, analyze performance metrics, and detect security threats seamlessly across your entire hybrid cloud network.
In this blog post, we will dive into the details of these new Kentik Cloud capabilities and explore how they can uplevel your network monitoring and troubleshooting.
Key benefits of Kentik Cloud’s enhanced AWS and Google Cloud support
- Centralized visibility: Kentik Cloud aggregates flow logs from AWS, Google Cloud, and every environment in your hybrid cloud, giving you a comprehensive view of network traffic across multiple VPCs and on-premises networks. Centralized logs from AWS Transit Gateways don’t require access to flow logs for every attached VPC.
- Advanced analysis: With Kentik’s powerful analytics engine, you can perform an in-depth analysis of flow logs from any cloud. Detect patterns, identify trends, and uncover anomalies in your network traffic. Use custom queries and filters to drill down into specific traffic patterns or attributes for detailed investigation.
- Real-time monitoring and alerting: Kentik Cloud processes flow logs in near real-time, enabling proactive monitoring and rapid issue detection. Set up custom alerts based on specific network conditions or security events to receive instant notifications when anomalies occur in any environment.
- Traffic optimization and performance analysis: By analyzing and visualizing flow logs from your cloud resources, Kentik Cloud helps you optimize network performance. Identify congested links, understand application-level traffic patterns, and make data-driven decisions to improve resource allocation and network efficiency.
- Enhanced security insights: Flow log analysis provides valuable insights into potential security threats and network vulnerabilities. Kentik Cloud shines a light in the cloud to detect suspicious traffic patterns, identify unauthorized access attempts, and strengthen your security posture.
What are Flow Logs and AWS Transit Gateways?
Flow logs are a valuable source of network traffic information in AWS. They capture detailed metadata about the traffic flowing through various components of your network, such as VPCs, subnets, and network interfaces. By analyzing flow logs, you can gain insights into network behavior, detect anomalies, monitor performance, and improve security.
AWS Transit Gateways act as a centralized hub for connecting multiple VPCs and on-premises networks. They simplify network architecture and enable efficient traffic routing between different environments. By consuming flow logs generated on AWS Transit Gateways, Kentik Cloud provides a unified view of traffic across VPCs and facilitates centralized monitoring and analysis.
How can I use Kentik Cloud’s AWS Transit Gateway Flow Log support?
Analyzing your transit gateway flow logs in Kentik Cloud can help you to troubleshoot cloud and hybrid network problems, plan network capacity based on past utilization patterns, detect suspicious traffic, and audit compliance with security policies. Let’s dig into the details.
Troubleshooting cloud and hybrid network problems
Transit Gateway Flow Logs allow you to analyze and detect patterns or anomalies across multiple VPCs, making it easier to identify and troubleshoot performance-impacting issues that span multiple environments. They capture detailed information about network traffic, including:
- Source and destination IP addresses
- Ports
- Protocols
- Packet counts
By analyzing these logs, you can gain visibility into the volume, patterns, and characteristics of traffic, such as whether it’s being dropped or incorrectly routed, to identify connectivity issues.
Analyzing Transit Gateway Flow Logs can also help in identifying performance bottlenecks. For example, you can recognize congested paths by examining which types of traffic use the same transit gateway as an important app or service, and assess latency and performance during high-traffic events. This information enables you to optimize network routing and adjust capacity, to improve network performance.
Network capacity planning
Transit Gateway Flow Logs contain information about network traffic volumes and patterns over time. Kentik’s Data Explorer allows you to compare performance across time periods according to the metrics and attributes you care about.
By analyzing and comparing historical logs, you can identify usage trends, peak traffic periods, and forecast future network capacity requirements. This helps in effective capacity planning and resource allocation; maybe you need to upgrade capacity or redistribute traffic among new VPCs or Direct Connects to deliver acceptable performance for peak traffic.

Detecting suspicious traffic
Transit Gateway Flow Logs provide visibility into network traffic, allowing you to detect potential security threats or anomalies. In the logs, you can identify suspicious or unauthorized access attempts, unusual traffic patterns, or communication with blacklisted IP addresses. Combined with Kentik Alerts, this helps detect and respond promptly to security incidents.
For example, an audit may be warranted if unexpected TCP traffic is flowing into a MariaDB instance but isn’t entering on port 3306. Similarly, connection requests on port 22, where teams don’t need SSH access to operate a service, may be a red flag that a bad actor is trying to access other resources on your network. Alerts can flag this activity before it impacts your organization.
Port scanning detection and alerting can also help to prevent network threats. Kentik can identify port scanning behavior by identifying unusual volumes or requests that originate from a single IP but have many destinations across your network. Centralized network observability and Transit Gateway Flow Log support make it simple to set up Alerts for this behavior, and make it easy to understand flagged activity.
Auditing compliance
Transit Gateway Flow Logs can assist with auditing network communications and upholding compliance requirements. By analyzing the logs, you can granularly track historical network activity, verify compliance with security policies, generate audit trails, and import enriched flow data to your SIEM to add context. This information can be useful for meeting regulatory requirements and conducting post-incident investigations.
For example, in the case that one of your company’s AWS accounts is involved in a security incident, you may need to answer the question, “Which VPC resources in other AWS accounts are attached to the Transit Gateway impacted by this incident?” to understand the blast radius. Using Transit Gateway Flow logs, you can easily answer this question by scanning flows from the affected accounts and VPCs in one place to check for unauthorized activity.
Kentik Map for Google Cloud
The Kentik Map visualizes every aspect of network infrastructure, both on-prem and cloud, to enable an instant understanding of how resources connect and how that impacts traffic patterns, network health, and customer experience. This searchable, interactive tool displays dynamic traffic, routing, and interconnect topology and metadata for all current and historical resources that customers own in Google Cloud. The Kentik Map automatically updates in real-time as networks change to provide maintenance-free documentation that’s always up to date – our customers love using it for:
- Planning cloud migrations
- Investigating connectivity and device issues
- Onboarding new employees
One unique benefit of Google Cloud is that its VPCs (Virtual Private Clouds) can span multiple regions, which limits overhead associated with scaling applications and services across regions and globally. To help customers make the most of this benefit, Kentik Map for Google Cloud groups VPCs by region, displaying the subnets in each region beneath each parent VPC. In addition, the map visualizes Dedicated Interconnect attachments, VM interfaces, and VPN gateways with their associated on-prem and cloud routers. It surfaces static link paths for on-prem routers and external VPN gateways and traffic links generated from subnets and internet types for easy access to the specifics users need to answer questions and solve network problems.

How do I enable Transit Gateway Flow Log Analysis in Kentik Cloud?
To leverage Kentik Cloud’s new capability for consuming and analyzing flow logs on AWS Transit Gateways, follow these steps:
- Integration setup: Connect your AWS account to Kentik Cloud by providing the necessary permissions to access flow logs. Kentik Cloud securely retrieves flow logs from your AWS environment.
- Flow Log ingestion: Kentik Cloud automatically ingests AWS Transit Gateway Flow Logs from a configured S3 bucket, ensuring a seamless data collection process. The ingestion process includes parsing and enriching flow log data for deeper analysis.
- Visualization and analysis: Once flow logs are ingested, use Kentik Cloud’s intuitive user interface to explore and analyze your network traffic. Create custom dashboards, visualizations, and reports to gain insights into your AWS network performance and behavior.
- Alerts and automation: Set up proactive alerts based on specific traffic conditions or security events. Configure automated actions, such as sending notifications, triggering workflows, or scaling resources based on defined thresholds.
To learn more, visit our AWS Cloud Observability page for a fully-featured demo video of Kentik Cloud, and check out our Google Cloud Observability page for a quick tour of the new Kentik Map for Google Cloud.
Ready to observe your networks? Try Kentik free for 30 days, or contact our team for a personalized demo.


