Summary
We’ve overhauled our Capacity Planning workflow. Read how our newest developments make capacity planning easier and more intuitive than ever.
Didn’t quite get to that task of capacity planning in December? Well, not to worry, this month Kentik has overhauled our Capacity Planning workflow and is introducing a slew of new features to make capacity planning easier and more intuitive than ever before.
Those who are familiar with Kentik will know that one of our core offerings is the ability to monitor and plan actual network and interface utilization. Network capacity planning involves figuring out interface utilization and when they’re approaching the limits of their capacity. Traditionally, capacity planning has been a completely manual process with complex spreadsheets to pull in the data, aggregate it, run statistics on it, and trend it over time.
With Kentik, the Capacity Planning workflow (Core » Capacity Planning) enables you to quickly assess the utilization of links relative to link capacity, leveraging SNMP data, so that you can take action before links become overloaded. You’ll see not only current traffic volume and daily forecasting, but also utilization trends and how soon your links are likely to reach capacity. (Note: we go beyond linear regression and use exponential regressions.)
You can assign interfaces to multiple groups and evaluate utilization independently for each group according to custom criteria. Kentik also enables you to set custom utilization indicators and alarms. These capabilities enable our customers to optimize the use of their infrastructure, delivering the best possible service while avoiding overutilization and overspending on capacity.
Capacity planning use cases
Besides keeping a close watch on utilization rates, the most common use cases for capacity planning include:
- Determining when to purchase or design upgraded bandwidth
- Viewing capacity to individual network providers to determine when to make network upgrades or decommission underutilized capacity for a given provider
- Viewing capacity of groups of customer interfaces to determine when to recommend network upgrades to a given customer
Enhancements to our Capacity Planning workflow
When we get recommendations from customers on how our products can be improved, we act! Our recently overhauled Capacity Planning workflow boosts network observability, enhances reporting, and improves consistency with other Kentik workflows.
For those who are familiar with the Kentik service, what follows is a summary of the enhancements and new features of the Capacity Planning workflow.
Enhancements:
- A new configuration interface, now similar to our Connectivity Cost UI
- Improved visibility into the configuration for Dynamic Groups
- Clear iconography to highlight whether the Capacity Plan Group is static or dynamic
- Enhanced landing status screen for each Capacity Plan that gives a status overview and a summary that highlights capacity issues
- More filtering options and details; now users can zero in on the exact interface they want to investigate via the table header, filter text field, or by severity
- The ability to export capacity plans as a CSV individually and globally
- Improved visualizations including a utilization gauge for each interface listed in the plan and inline traffic graphs for any interface
- The ability to show the traffic graph with the utilization thresholds configured for each interface in the plan’s details
New features:
- Filtering options that are instinctive, including the ability to feature Capacity Plans on the landing page based on severity
- SNMP Configuration Warning if not all router-type devices don’t have SNMP configured
- New reports for either the entire set of Capacity Plans, or individually, are now easily accessible in either PDF, email and/or CSV
Capacity Planning in Kentik
For those who aren’t customers or haven’t spent time in the Kentik portal, what follows are some visualizations of the Capacity Planning workflow. You can experience it yourself by starting a trial at any time.
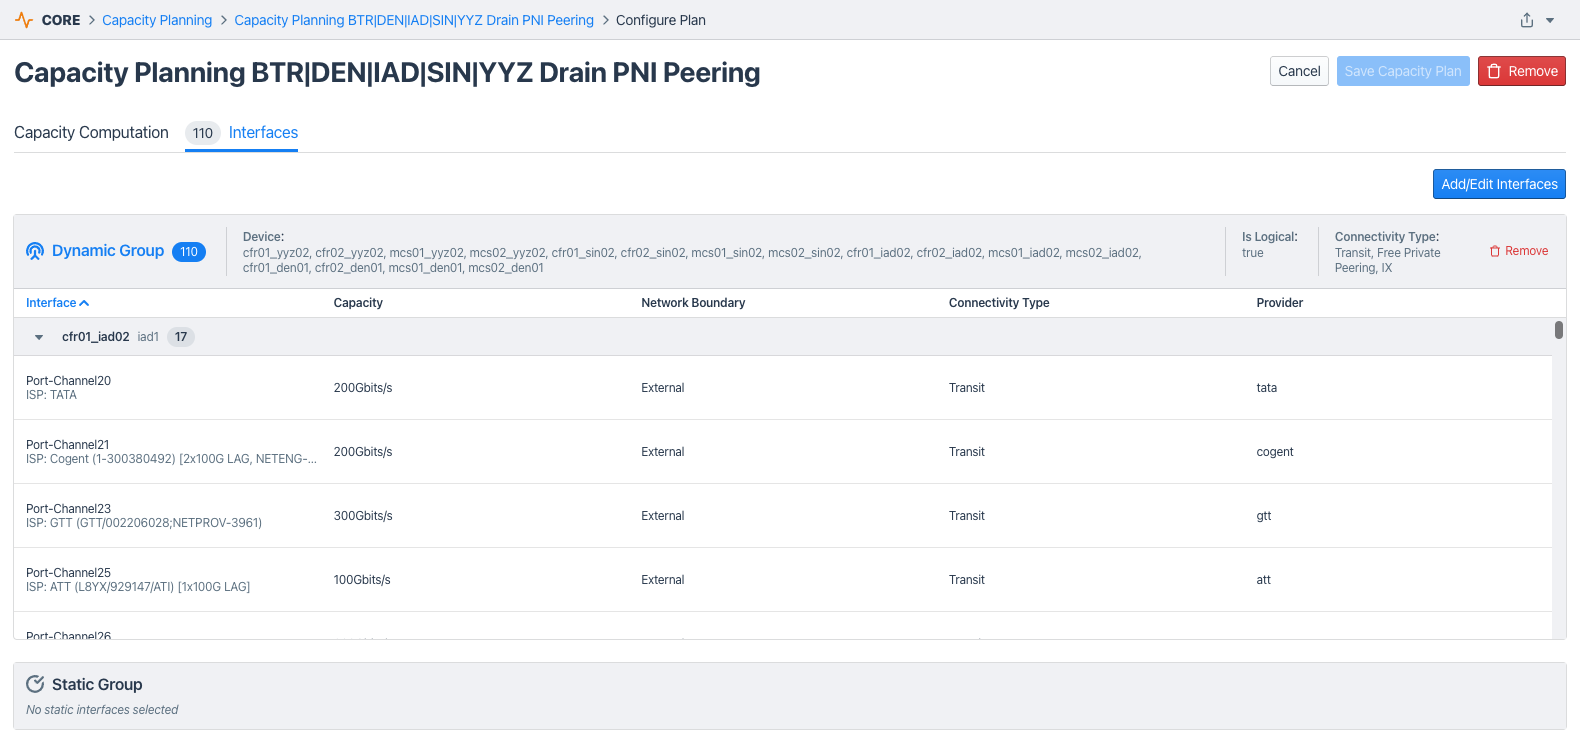
The configuration allows you to create groups of interfaces and place a capacity/cost configuration onto them. You can also set warning and critical ranges using the sliding scale.

Dynamic groups can rely on interface attributes such as the device they are on, the site they are part of, the provider/customer they’re connected to, as well as the type of connection they are serving (transit, peering, backbone, customer, etc.).
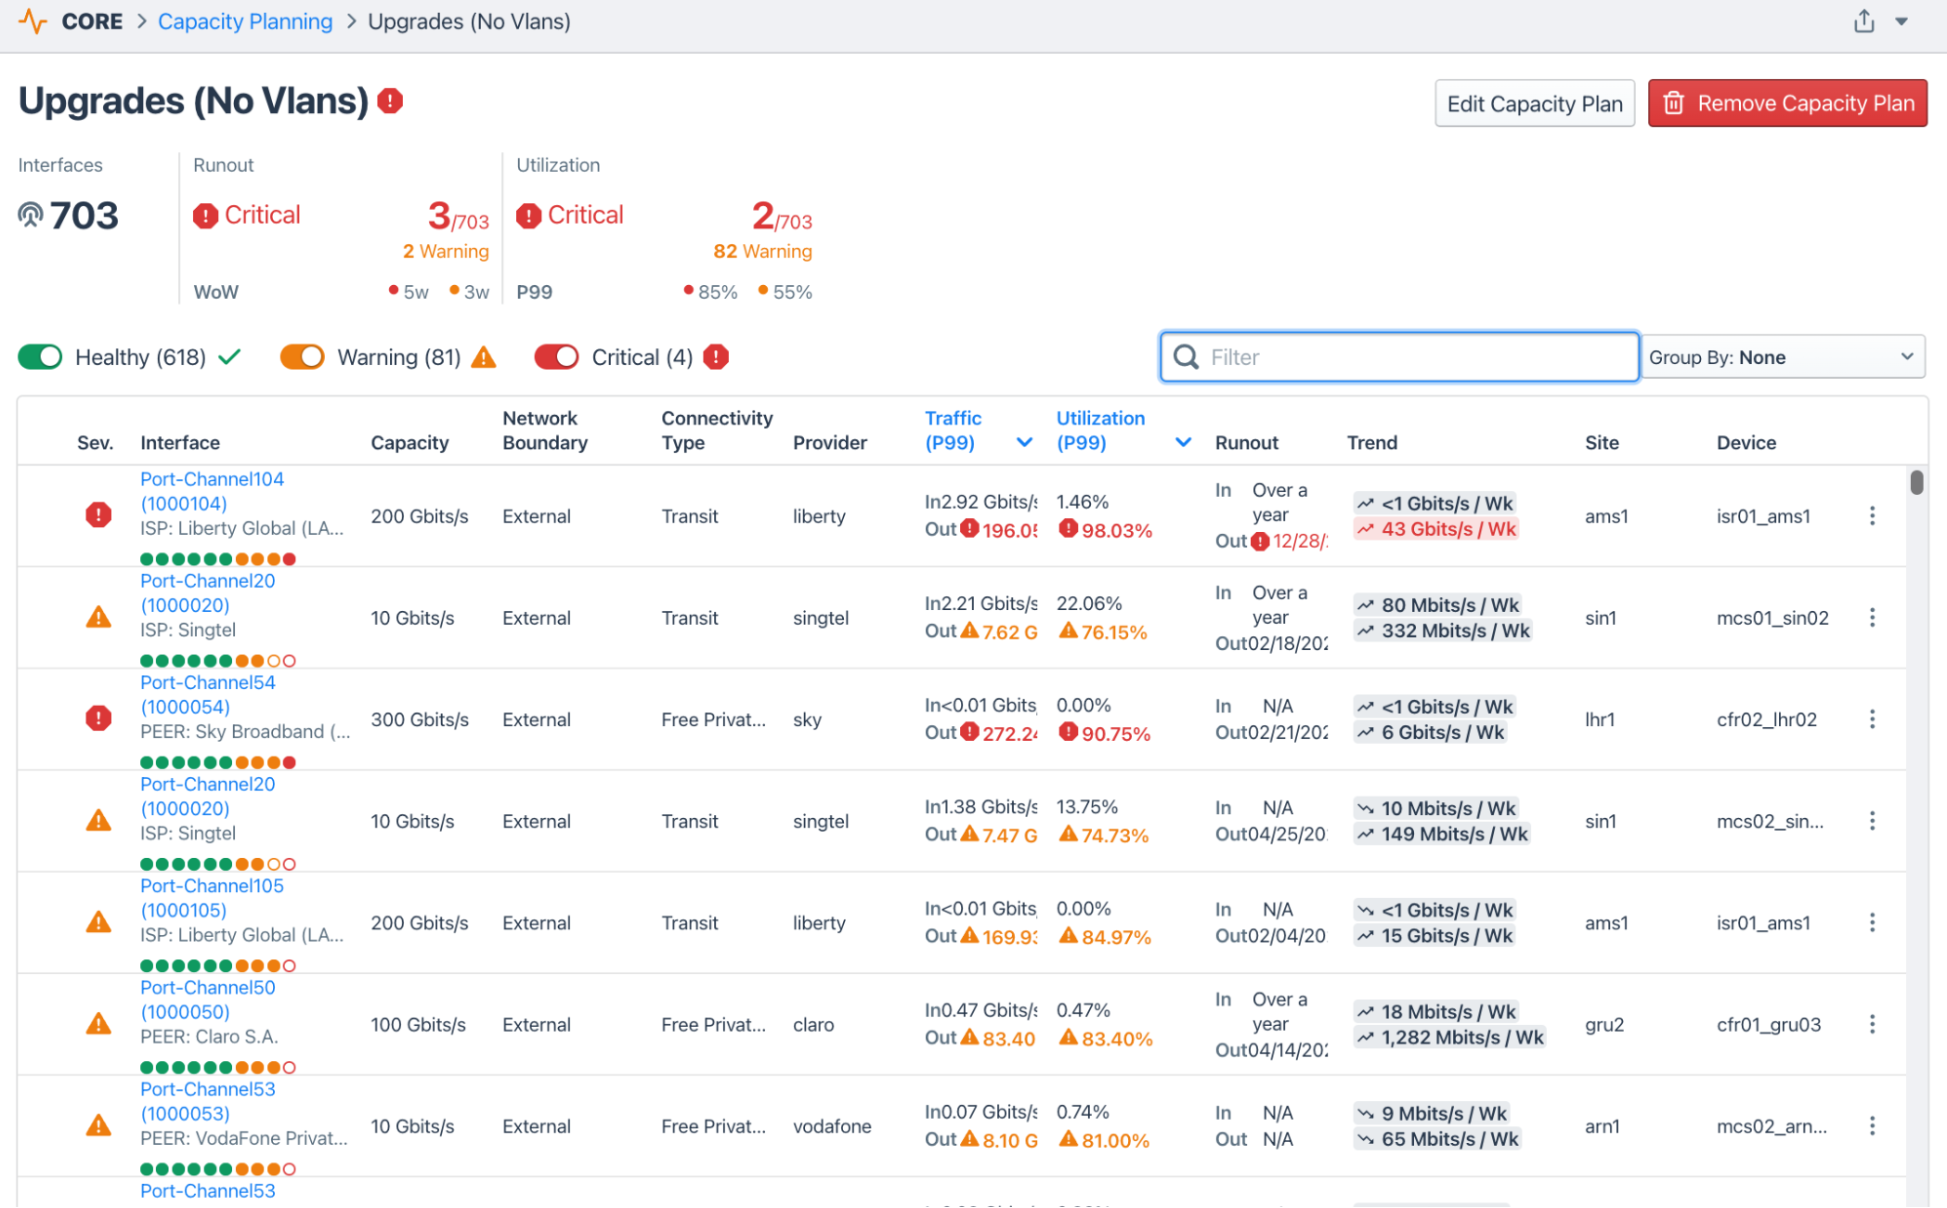
The capacity plan details page can be sorted by filters, column or severity.
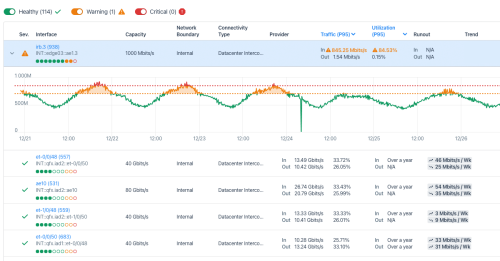
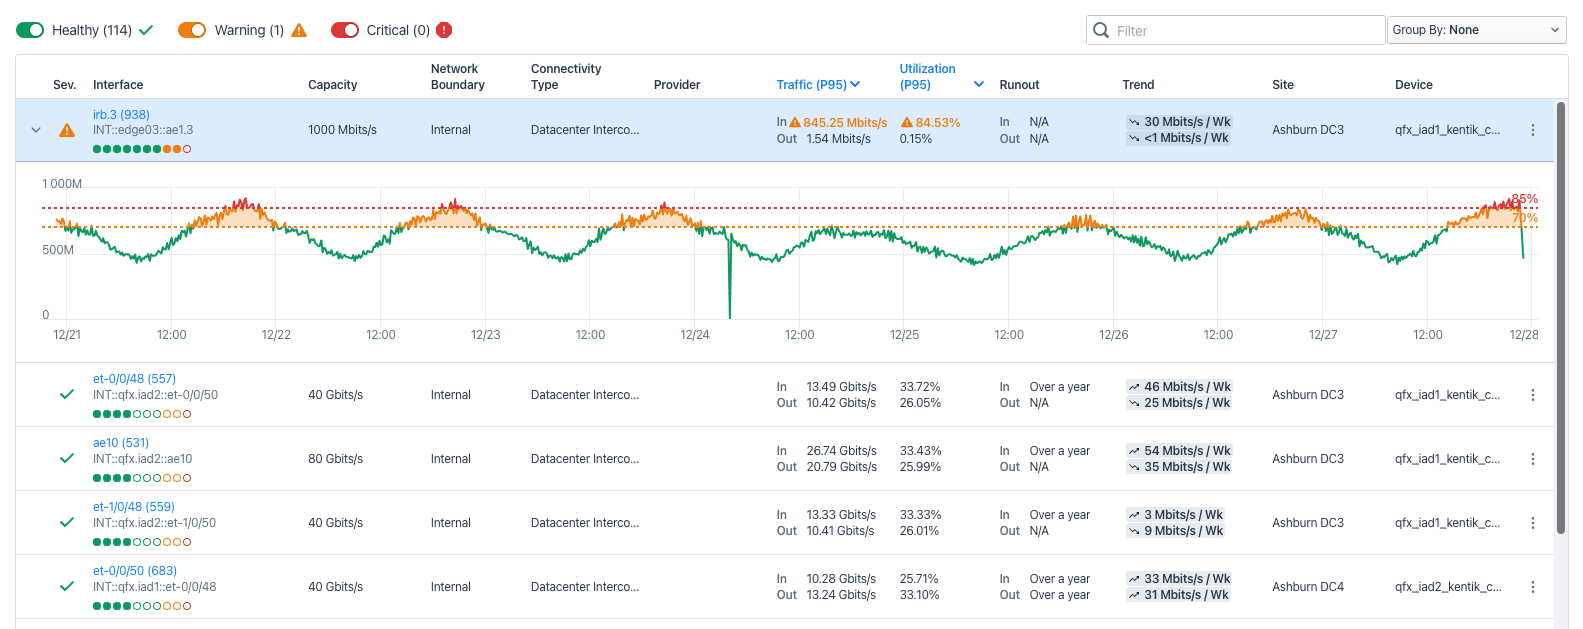
Clicking on any interface row in the Capacity Plan’s details page unveils a traffic graph inline for the interface. This traffic chart includes the utilization threshold and colors the area above them with the relevant severity color.
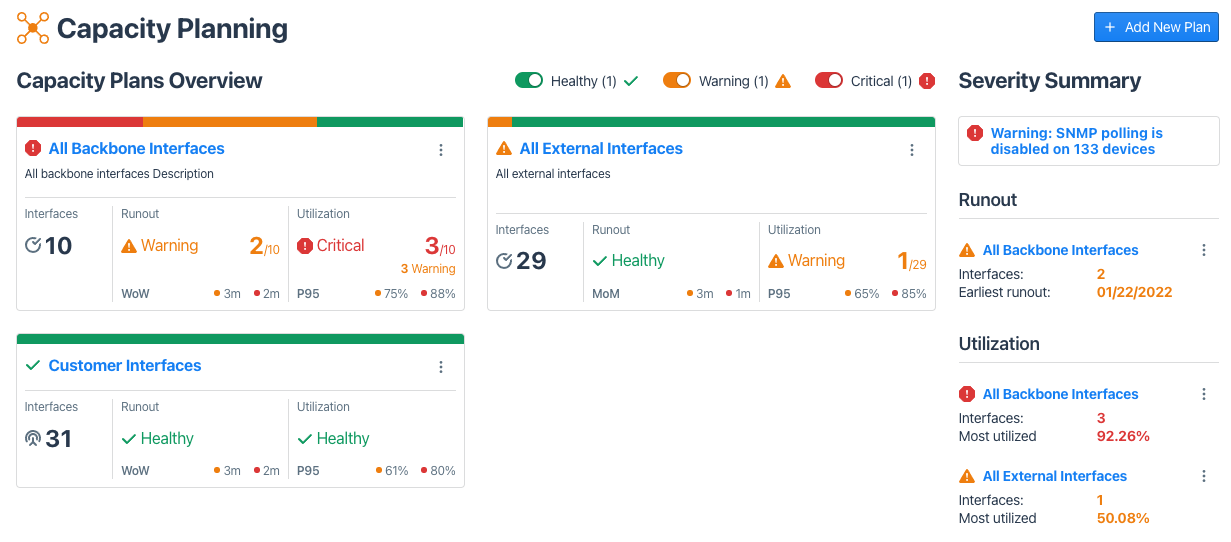
Here’s what your Capacity Plan landing page will look like once you’ve set your parameters and groups. Hopefully, there will be less red and orange!
If you’d like to learn more about how to plan and monitor your network capacity using Kentik, reach out to our team for a demo or to start your evaluation.

