Network Observability: Beyond Metrics and Logs

Summary
The network is the metaphorical plumbing through which all your precious non-metaphorical observability and monitoring data flows. It holds secrets you’ll never find anywhere else. And it’s more important today than ever before.
These days, when you want to discuss tracking the state, stability, and overall performance of your environment, from the bottom layer of infrastructure all the way up to the application, we don’t say “monitoring.” We use the word “observability.”
Now I like “observability.” It’s got history. Power. Gravitas. But…
Respect your elders
When I started out doing this work – installing and sometimes even creating solutions to track how my stuff was doing, and later replicating the same work to track how an entire business’ stuff was doing – we didn’t have any of this fancy “observability” stuff.
No, I’m not saying, “Back in my day, we had to smack two rocks together and listen for the SNMP responses.” I’m saying that when I started, we had no way to understand the real user experience. What we had were metrics and logs from discrete elements and subsystems, which we had to cobble together and then extrapolate the user’s experience from that information.
And then, almost miraculously, application tracing came onto the scene. Finally, we had the thing we’d always wanted. Not by inference, not using a synthetic test. We had the user’s actual experience, in real time. It was glorious.
And it completely blinded us to anything else. Yes, in that moment “observability” was born. But in many ways “monitoring” died. Or, perhaps more accurately, it was dismissed to a dim corner of the data center, to be referred to infrequently, and respected even less often.
And this was, in my opinion, to our overall detriment. The truth is, you won’t fully understand the health and performance of your application, infrastructure, or overall environment until and unless you include metrics. And more specifically, until you understand the network side of it.
And that’s the goal of this blog post: to share the real, modern, useful value of network monitoring and observability and show how that data can enhance and inform your other sources of insight.
What network observability is not
For many tech practitioners, the idea of monitoring the network begins and ends with ping.

Or worse, with PCAP and a long slog through wireshark.

To be honest, if it were true that this was the best that “network monitoring” had to offer, nobody – including me – would want to deal with it. But, after 35 years working in tech, and 25 of those years focused on monitoring and observability, I’m happy to report that it’s not true. Network monitoring and observability are way more than that.
The difference between monitoring and observability
Before I go any further, I think it’s important to clarify what I mean when I say “monitoring” and “observability,” and if there are any meaningful differences between those terms (there are). While a lot of ink has been spilled (to say nothing of several flame wars on social media) on this topic, I believe I can offer a high-level gloss that will both clarify my meaning and also avoid having amazing folks like Charity Majors show up at my house to slap me so hard I’ll have observability of my own butt without having to turn around.
“Monitoring” solutions and topics concern themselves with (again, broadly speaking):
- Known unknowns: We know something could break, we just don’t know when.
- All cardinalities of events: No matter how common or unique something is, monitoring wants to know about it.
- (Mostly) manual correlation of events: The data is so specific to a particular use case, application, or technology combination that understanding how events or alerts relate to each other is something humans have to be involved with.
- Domain-specific signals: The things that indicate a problem in one technology or system (like networking) bear no resemblance to the things that would tell you a different tech or system is having an issue (like the database).
Conversely, “observability” is focused on:
- Unknown unknowns: There’s no idea what might go wrong, and no idea when (or if) it will ever happen.
- High cardinality: The focus is on unique signals, whether it’s a single element or a combination of elements in a particular span of time.
- Correlation is (mostly) baked-in: Because of the high quantity and velocity of data that has to be considered, a human can’t possibly reason about it, and it requires machines (ML, or that darling marketing buzzword “AI”) to really get the job done.
- Understanding a problem based on the “golden” signals of latency, traffic, errors, and saturation.
With those definitions out of the way, we can circle back to network observability.
Getting to the point
In many blog posts, this section would be where I begin to build my case by first educating you on the history of the internet, or how networking works, or why an old-but-beloved technology like SNMP still had relevance and value.
Forget that noise. I’m going to skip to the good stuff, get straight to the essence of the question. What is network observability, and why do you need it?
Network observability goes beyond simply being able to see that your application is spiking.

It’s also understanding the discrete data types that make up the spike, both in this moment and over time. Moreover, network observability is being able to tell where the traffic – both overall and those discrete data types – is coming from and going to.

Because your response to spiked data is going to be significantly different if the majority of the spike is due to authentication traffic versus database reads or writes versus streaming data coming from Netflix to the PC used by Bob in Accounting.
Speaking of where that traffic is going, network observability means knowing when your application is sending traffic in directions that are latency-inducing – or worse, cost inducing!

This chart shows a “hairpin”: traffic leaves New York on the left, routes to Chicago, and then…
Comes right back to New York. Straight out, and straight back in. Why would something like this happen? It’s surprisingly easy to do without realizing it. Examples include having the application server in New York, but user activity has to authenticate, which makes a call to a server in Chicago. Or a process that includes an API call to a server in the other location. Or a dozen other common scenarios.
Hairpinning traffic isn’t just inefficient. If you are talking about a cloud-based environment it introduces extra cost, because you will pay on both egress and ingress of that traffic on both sides of the (in this case) New York-Chicago transfer.
The challenge isn’t in solving the problem – that’s as easy as adding a local device or replica to provide authentication, data, or whatever is needed – the real challenge is in identifying that traffic.
Network observability means having visualizations that allow folks from all IT backgrounds, not just hard-core network engineers, to see that it’s happening.
Speaking of cost, this chart might tell you something in your application is spiking…

…but it doesn’t really give you the insight to identify whether this is bad or simply inconvenient.
Network observability is having the means to understand which internal network(s) that traffic is coming from, and whether any (or all) of it is headed outbound, not to mention its final destination.

Because in the image above, all of that traffic is costing you money!
As much as we throw around the term “cloud native,” the vast majority of us work in environments that are decidedly hybrid: a mixture of on-prem, colo, cloud (and, in many cases, multiple cloud providers).
Network observability is also the ability to show traffic in motion.

So we can see how and when it’s getting from point A to B to Q to Z.
“The internet” itself is a “multipath” environment. This means that the packets of a single transaction can each take decidedly different routes to the same destination.

Network observability includes being able to see each stop (or “hop”) along that multipath journey, for each packet, as well as the latency between those hops. This helps you identify why application response may be inconsistently sluggish.
Moreover, network observability is the ability to see that multipath experience from multiple points of origination. This allows you to understand not just a single user’s experience, but the experience of the entire base of users across the footprint of your organization.

Because the question we find ourselves asking isn’t normally “Why is my app slow?”, it’s “Why is my app slow from London, but not from Houston?”
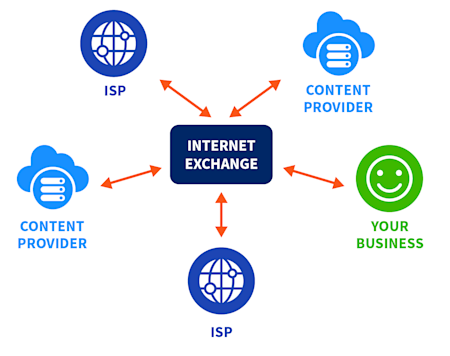
Unless you’re a long-time network engineer, you’ve probably never heard about IX (internet exchange) points, so let me explain:

An IX is a physical facility that hosts routers belonging to multiple private sources – ISPs, content providers, telecom companies, and also private businesses (like yours, probably). By putting all those routers in one place and allowing them to interconnect, IXes facilitate the rapid exchange of data between disparate organizations. They effectively make the internet smaller and closer together.
Picking the right IX to help route traffic to/from key partner networks can make the difference between a smooth versus a sluggish experience for your users.
But honestly, how could anyone know what the “right” IX is? It would require hours of analysis of current traffic patterns, then comparing those to the types of traffic hosted by various IXes, and then trying to select the correct one.
And, to be fair, back in the day it did take hours, and was something nobody looked forward to doing.

But network observability also includes having that type of information – both the understanding of your network traffic and the traffic (and saturation) of open IX points – and being able to quickly select the best one for your needs.
The mostly unnecessary summary
Just as “observability” is more than just traces, network observability is more than metrics. It’s a unified collection of technologies and techniques, coupled with the ability to collect, normalize, and display all of that data in meaningful ways – effectively transforming data into information, which drives understanding and action.


