Basic Network Troubleshooting: A Complete Guide
Summary
The basics of network troubleshooting have not changed much over the years. When you’re network troubleshooting, a lot can be required to solve the problem. You could be solving many different issues across several different systems on your complex, hybrid network infrastructure. A network observability solution can help speed up and simplify the process.
The Network is the Key
“The network is down!” — I’m sure you heard that before.
Despite your best efforts as a network engineer, network failures happen, and you have to fix them. Hopefully, you’ve implemented a network observability platform in advance, so you should be collecting a wealth of information about your network, making troubleshooting easier.
But what happens when it’s time to activate troubleshooting mode?
In this post, I’m going to talk about the steps to troubleshoot your network. And then I’ll provide some best practices, as well as provide examples of troubleshooting with Kentik’s network observability solutions.
What is Network Troubleshooting?
Network troubleshooting is the process of solving problems that are occurring on your network, using a methodical approach. A simple definition for what can often be a hard task!
When users complain, whether they’re internal or external to your organization — or ideally, before they do — you need to figure out what the cause of their problem is. The goal is to troubleshoot and fix whatever issue underlies the problems.
Troubleshooting requires taking a methodical approach to resolving the issue as quickly as possible. Unfortunately for you, the user doesn’t care what your service-level objective for fixing the problem is. In today’s “gotta have it fast” culture, more often than not, you need to fix it now — or revenue is affected.
Let’s get into some ways you can troubleshoot your network and reduce your mean time to repair (MTTR).
About Kentik: Kentik is a network intelligence platform that helps network teams troubleshoot faster by correlating traffic flows, routing changes, device health metrics, and synthetic test results in one place. With AI-assisted investigations and change triage, teams can answer “what changed?” quickly and pinpoint whether the issue is a path change, a congested interface, an upstream provider, or an application dependency.
Learn how AI-powered insights help you predict issues, optimize performance, reduce costs, and enhance security.
Basic Network Troubleshooting Processes
Identify the Problem
When you’re troubleshooting network issues, complexity and interdependency make it complex to track down the problem. You could be solving many different issues across several different networks and planes (underlay and overlay) in a complex, hybrid network infrastructure.
The first thing you want to do is identify the problem you’re dealing with. Here are some typical network-related problems:
- A configuration change broke something. On a network, configuration settings are constantly changing. Unfortunately, configuration change accidents can happen that bring down parts of the network.
- Interface dropping packets. Interface issues caused by misconfigurations, errors, or queue limits lead to network traffic failing to reach its destination. Packets simply get dropped.
- Physics limitations on connectivity. Sometimes, your connections don’t have enough bandwidth. Or the latency is too much between source and destination. These lead to network congestion, slowness, or timeouts.
- Problems in the cloud. Intra- or inter-cloud connectivity problems can have their own unique set of causes and challenges. Often driven by someone else’s congestion, oversubscription, or software failures.

Find Your Network Troubleshooting Tools
Fixing these kinds of troubleshooting problems needs more than identification. To paraphrase French biologist Louis Pasteur — where observation is concerned, chance favors only the prepared mind.
No network engineer can troubleshoot without being prepared with their tools and telemetry. So once you’ve identified that there is a problem, it’s time to use your network troubleshooting tools.
Ideally, you have tools and telemetry in advance, so your network observability toolchain is using AI to automatically identify problems and linking you to a jumping off point so you can drive down both MTTK (Mean Time to Know) and either MTTR (Mean Time to Repair) or MTTI (Mean Time to Innocence).
Here are a few examples of basic network troubleshooting tools:
- Ping
- Tracert/ Trace Route
- Ipconfig/ ifconfig
- Netstat
- Nslookup
- Pathping/MTR
- Route
- PuTTY
The First Step — Ping Affected Systems
When your network is down, slow, or suffers from some other problem, your first job is to send packets across the network to validate the complaint. Send these pings using the Internet Control Message Protocol (ICMP) or TCP to one or any of the network devices you believe to be involved.
The ping tool is a utility that’s available on practically every system, be it a desktop, server, router, or switch.
There’s a sports analogy that says “the most important ability is availability” for systems. If you can’t reach it, it’s not available to your users.
Sending some ICMP packets across the network, especially from your users’ side, will help answer that question, if your platform isn’t presenting the path to you automatically. In some cases if ICMP is filtered, you can usually switch to TCP (Transmission Control Protocol) and use tcping, telnet, or another TCP-based method to check for reachability.
Get the Path with Traceroute
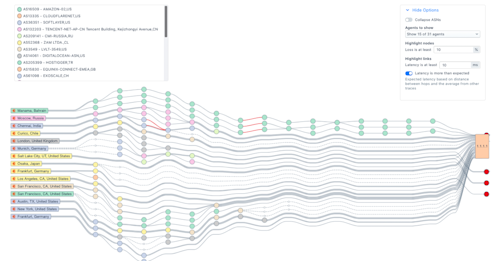
If you’re not getting any ping responses, you need to find out where the ping is stopping. You can use another ICMP-based tool to help, and that’s traceroute.
Your ping could be getting stopped because ICMP isn’t allowed on your network or by a specific device. If that’s the case, you should consider TCP Traceroute on Linux, which switches to TCP packets.
From traceroute, since you will see the path of IP-enabled devices your packets take, you will also see where the packets stop and get dropped. Once you have that, you can further investigate why this packet loss is happening. Could it be a misconfiguration issue such as a misconfiguration of IP addresses or subnet mask? A misapplied access list?
Test Your Network with Synthetic Monitoring
Tool such as Kentik Synthetic Monitoring enable you to continuously test network performance (via ICMP, TCP, HTTP, and other tests) so you can uncover and solve network issues before they impact customer experience. Ping and traceroute tests performed continuously with public and/or private agents generate key metrics (latency, jitter, and loss) that are evaluated for network health and performance.
To get ahead of the game, Kentik also allows you to set up autonomous tests, so there’s already test history to your top services and destinations. You can also run these continuously (every second, like the ping command default) for high resolution.

Device Commands and Database Logs
Now that you’ve identified the network device or group of devices that could be the culprit, log into those devices and take a look. Run commands based on your device’s network operating system to see some of the configuration.
Take a look at the running configuration to see what interfaces are configured to get to the destination. You can take a look at system logs that the device has kept for any routing or forwarding errors. You can also look at antivirus logs on the destination systems that could be blocking access.
At this point, you may find yourself unable to get enough detail about the problem. Command line tools are telling you how things should work. What if everything’s working the way it should? What now? Or you might be getting overwhelmed by the amount of log data.
Device Configuration Changes
Many network outages relate to changes that humans made! Another key step on the troubleshooting path is to see if anything changed at about the same time as issues started.
This information can be found in logs of AAA (Authentication, Authorization, and Accounting) events from your devices. Ideally stored centrally, but often also visible by examining the on-device event log history.
Packets and Flows
The old saying about packet captures is that packets don’t lie! That’s also true for flow data, which summarizes packets.
Both packets and flows provide information about the source and destination IP addresses, ports, and protocols.
When getting flow data, you’re not as in the weeds as during a packet capture, but it’s good enough for most operational troubleshooting. Whether it’s with NetFlow, sFlow, or IPFIX, you’ll be able to see who’s talking to whom and how with flow data going to a flow collector for analysis.
Capturing packet data is truly getting into the weeds of troubleshooting your network. If it’s unclear from flow, and often if it’s a router or other system bug, you may need to go to the packets.
Unless you have expensive collection infrastructure, it’s also often more time consuming for you than any of the other tools above. Whether it’s tcpdump, Wireshark, or SPAN port, you’ll be able to get needle-in-the-haystack data with packet captures.
One great middle ground is augmented flow data, which captures many of the elements of packets. This can be great if you can get performance data, but not all network devices can watch performance and embed in flow — in fact, the higher speed the device, the less likely it is to support this kind of enhancement.
Collecting and analyzing packets and flows is where you start to venture into the next step. You’re using a mix of utility tools (tcpdump) and software (Wireshark, flow collector). If you’re expecting to keep a low MTTR, you need to move up the stack to software systems.
Up the Stack
If you can’t find issues using these tools and techniques at the network level, you may need to peek up the stack because it could be an application, compute, or storage issue. We’ll cover more on this cross-stack debugging in a future troubleshooting overview.
Kentik Network Observability
Of course, network performance monitoring (NPM) and network observability solutions such as Kentik can greatly help avoid network downtime, detect network performance issues before they critically impact end-users, and track down the root cause of network problems
In today’s complex and rapidly changing network environments, it’s essential to go beyond reactive troubleshooting and embrace a proactive approach to maintaining your network. Network monitoring and proactive troubleshooting can help identify potential issues early on and prevent them from escalating into more severe problems that impact end users or cause downtime.
Kentik’s Network Observability solutions, including the Network Explorer and Data Explorer, can be invaluable tools in implementing proactive troubleshooting strategies. By providing real-time and historical network telemetry data and easy-to-use visualization and analysis tools, Kentik enables you to stay ahead of potential network issues and maintain high-performing, reliable, and secure network infrastructure.
Network Explorer Solution
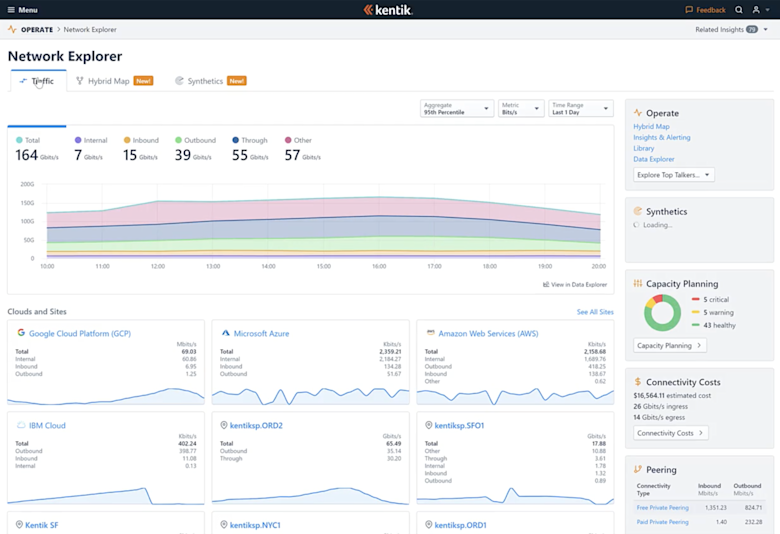
Kentik Network Explorer provides an overview of the network with organized, pre-built views of activity and utilization, a Network Map, and other ways to browse your network, including the devices, peers, and interesting patterns that Kentik finds in the traffic.
To make NetOps teams more efficient, Kentik provides troubleshooting and capacity management workflows. These are some of the most basic tasks required to operate today’s complex networks, which span data center, WAN, LAN, hybrid and multi-cloud infrastructures.
The Network Explorer combines flow, routing, performance, and device metrics to build the map and let you easily navigate. And everything is linked to Data Explorer if you need to really turn the query knobs to zoom way in.
Data Explorer Solution
If you can’t find the obvious issue with something unreachable or down, it’s key to look beyond the high level and into the details of your network.
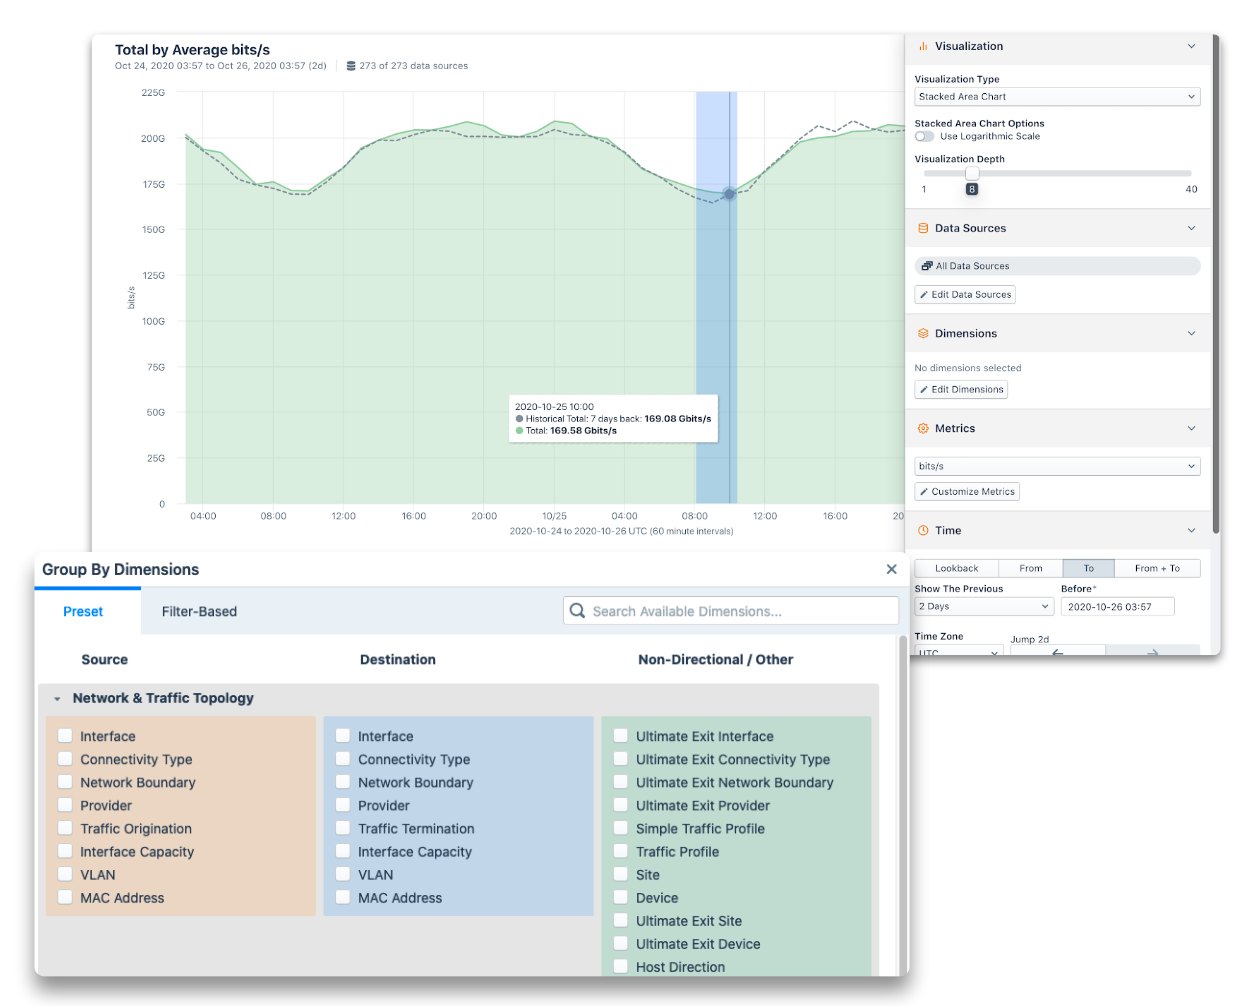
Kentik Data Explorer provides a fast, network-centric, easy-to-use interface to query real-time and historic network telemetry data. Select from dozens of dimensions or metrics, 13 different visualizations and any data sources. Set time ranges and search 45 days or more of retained data. Query results within seconds for most searches.
This lets you see traffic, routing, performance, and device metrics in total, by device, region, customer, application, or any combination of dimensions and filters that you need to zoom in and find underlying issues.
Kentik’s Data Explorer provides graphs or table views of network telemetry useful for all types of troubleshooting tasks.
Software Tools Help Facilitate Network Troubleshooting
Marc Andreessen of Netscape fame once said that, “software is eating the world.” But software has made things a lot easier when it comes to network troubleshooting. It has taken over from the manual tools run from a terminal or network device.
There are software tools that ping not just to one device but multiple devices simultaneously for availability and path. Many are flow and packet data stores with software agents sending network data. All this is done and put on a nice dashboard for you. Network troubleshooting is still hard, but software makes it easier.
However, in this cloud-native and multi-cloud infrastructure era, some software makes it easier than others. For that, you need to move beyond traditional monitoring software because it’s not enough anymore. You need to move to observability software.
With software tools like products from Kentik, you can use the devices to send data to observe the state of your network instead of pulling it from the network.
Network Troubleshooting Best Practices
Whether you’re using network observability tools, or have a network small enough where the other tools are sufficient, here are some best practices you should consider.
Develop a Checklist
You should develop a checklist of steps like what I’ve outlined above when troubleshooting.
In his book The Checklist Manifesto, Dr. Atul Gawande discusses how checklists are used by surgeons, pilots, and other high-stress professionals to help them avoid mistakes. Having a checklist to ensure that you go through your troubleshooting steps promptly and correctly can save your users big headaches. And save you some aggravation.
Over time, this checklist will likely become second nature, and having and following it ensures you’re always on top of your game.
Ready Your Software Tools
You want to have already picked the network troubleshooting tools you need to troubleshoot a network problem before you get an emergency call. That isn’t the time to research the best software tool to use. By then, it’s too late.
If you run into a network troubleshooting problem that took longer than you hoped with one tool, research other tools for the next time. But do this before the next big problem comes along.

Get Documentation
It’s tough to jump on a network troubleshooting call and not know much about the network you’re going to, well, troubleshoot. IT organizations are notorious for not having enough documentation. At times, you know it’s because there aren’t enough of you to go around.
But you have to do what you can. Over time, you should compile what you learn about the network. Document it yourself if you have to, but have some information. Identify who owns what and what is where. Otherwise, you could spend lots of troubleshooting time asking basic questions.
Prepare Your Telemetry
In addition to having the software to move with speed, you’ll need to be already sending, saving, and ideally detecting anomalies over your network telemetry. For more details on network telemetry, see our blog posts “The Network Also Needs to be Observable” and “Part 2: Network Telemetry Sources”.
Follow the OSI
If you closely follow the toolset above, you may have noticed that I’m moving up the stack with each tool.
In some ways, I’m following the Open Systems Interconnection (OSI) stack. When troubleshooting, you want to start at the physical layer and work your way up. If you start by looking at the application, you’ll be masking potential physical connection problems such as interface errors or routing issues happening at layer 3. Or any forwarding problems at layer 2.
So follow the stack, and it won’t steer you wrong.
Preparedness and Network Troubleshooting
And there it is. When the network is down, troubleshooting can be a daunting task, especially in today’s hybrid infrastructure environments.
But if you follow the steps I’ve outlined, you can make things easier on yourself. Create your network troubleshooting checklist, decide on your toolset, and get ready. If it’s not down now, the network will likely be down later today.
Now that you know this about network troubleshooting, you’ll be ready when the network issues affect traffic in the middle of the night. You won’t like it; nobody likes those 1:00 A.M. calls. But you’ll be prepared.

