OTT Service Tracking Gets a Major Facelift and Update!

Summary
Today we’re introducing the most important update to OTT Service Tracking for ISPs since its inception. To understand the power of this workflow, we’ll review the basics of OTT service monitoring and explain why our capability is so popular with our broadband provider customers.
Today we’re introducing the most important update to OTT Service Tracking for ISPs since its inception. To understand the power of our workflow, I’ll first discuss the basics of OTT (over-the-top) service monitoring and then explain why our enhanced capability is so popular with our broadband provider customers.
For broadband providers, commonly referred to as “eyeball networks,” it’s difficult to clearly visualize their digital supply chain. Case in point, below is a real-life, anonymized example of a video OTT service which shows how content is handed over to the broadband provider’s network:
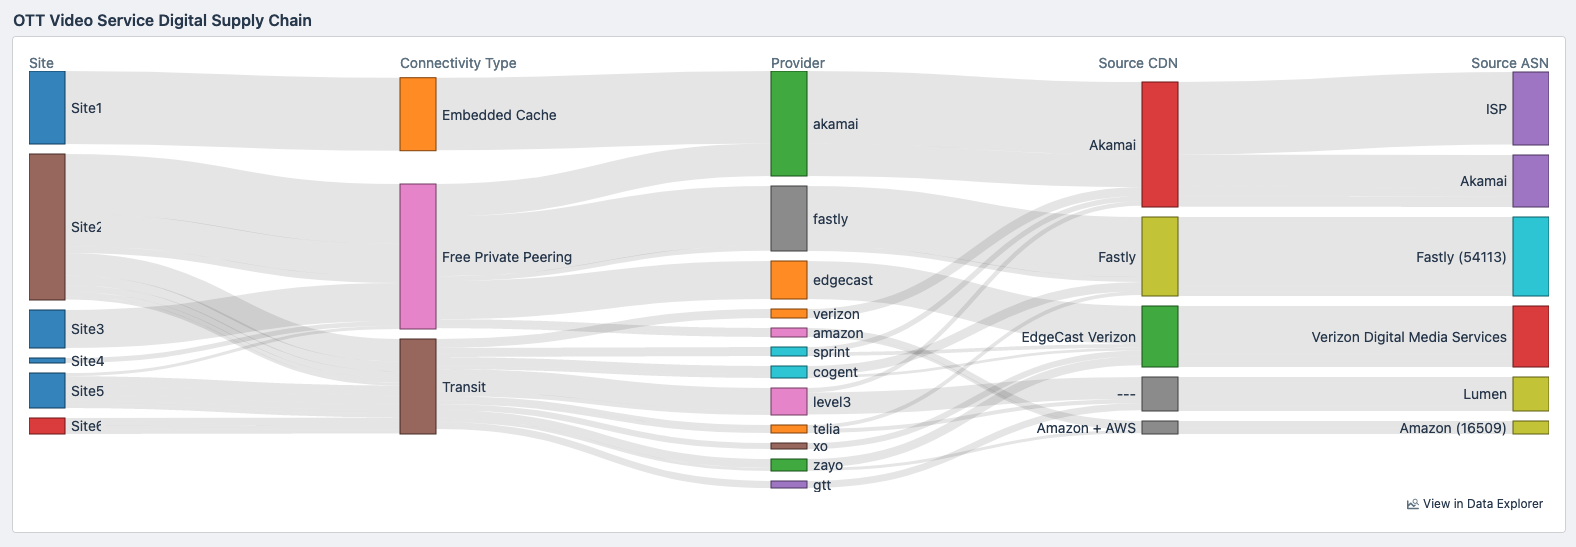
Notice how a single OTT content provider leverages all methods at their disposal to deliver traffic to this one ISP, including:
- Embedded caching, private peering and transit types of edge connectivity
- Leveraging at least four commercial CDNs
Mastering the cost-versus-performance balance made our OTT Service Tracking workflow so popular with broadband ISPs for a couple of reasons:
- There are hundreds of different OTT content providers out there, and each one comes with a complex arrangement of connectivity types and CDN providers.
- Each combination of entry site, connectivity type and CDN comes with its own variations of:
- Cost at the interconnection edge
- Performance perceived by the subscriber consuming the content
- Interfaces on the edge of the network that need enough capacity to deliver that traffic
Kentik True Origin is the engine (or secret sauce) that powers OTT Service Tracking workflow (and our CDN Analytics workflow, too). True Origin detects and analyzes the DNA of over 350 categorized OTT services and providers and more than 50 CDNs in real time, all without the need to deploy DPI (deep packet inspection) appliances behind every port in the network.
The OTT Service Tracking workflow allows providers to plan and execute what matters to their subscribers, including:
- Maintaining competitive costs
- Anticipating and fixing subscriber OTT service performance issues
- Delivering sufficient inbound capacity to ensure resilience
Better, Faster, Stronger
Whether it’s a new video-game release, network edge interfaces running hot, or subscribers complaining about rebuffering, when broadband providers face a content event, two questions always get raised:
- Is there a noticeable performance impact?
- How many subscribers are impacted by the event?
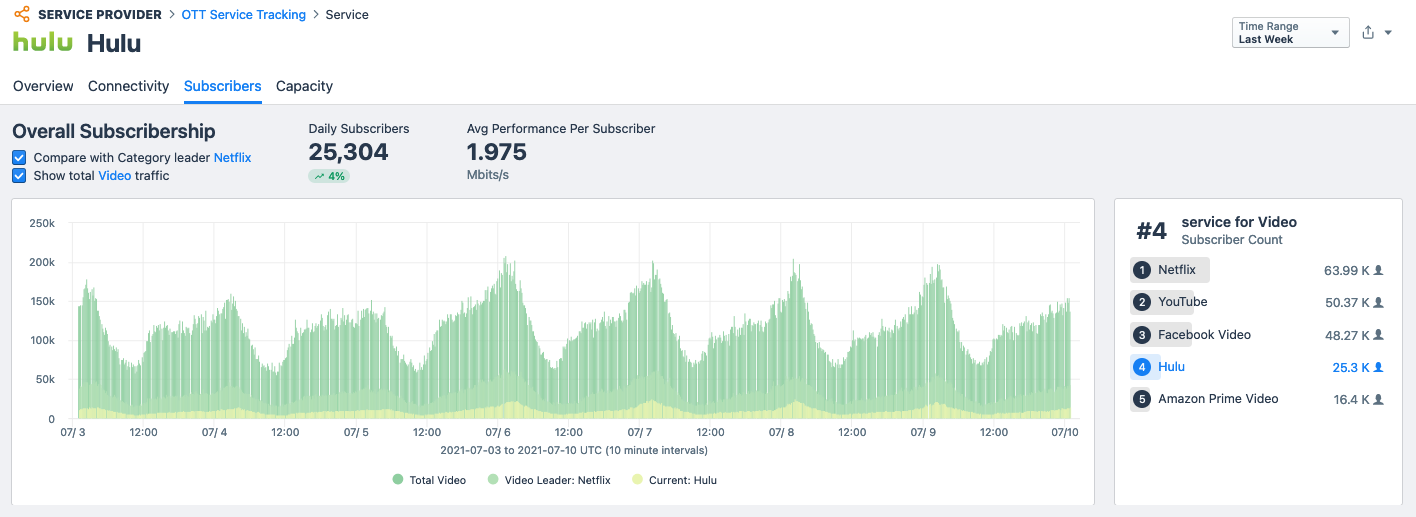
With our latest updates to our OTT Service Tracking workflow, we’re happy to say that we can help you better answer these questions. You’ll find these improvements in our new “Subscribers” tab of any “OTT Service Details” screen.
The data needed to answer the two questions above are not a native part of network telemetry, and are not easy to inspect at an OTT service level. Yet, there are reasonable proxies to subscribership count and performance measurements that Kentik uses to help.
Performance can be observed by looking at the average/95th percentile/max value of Mbps, per unique destination IP — as long as you are able to isolate traffic destined to subscribers for a specific OTT service. As mentioned in the previous section, performance variations also need to be observed by delivery site, connectivity type or provider, now offered in the “Subscribership” tab for any OTT service.
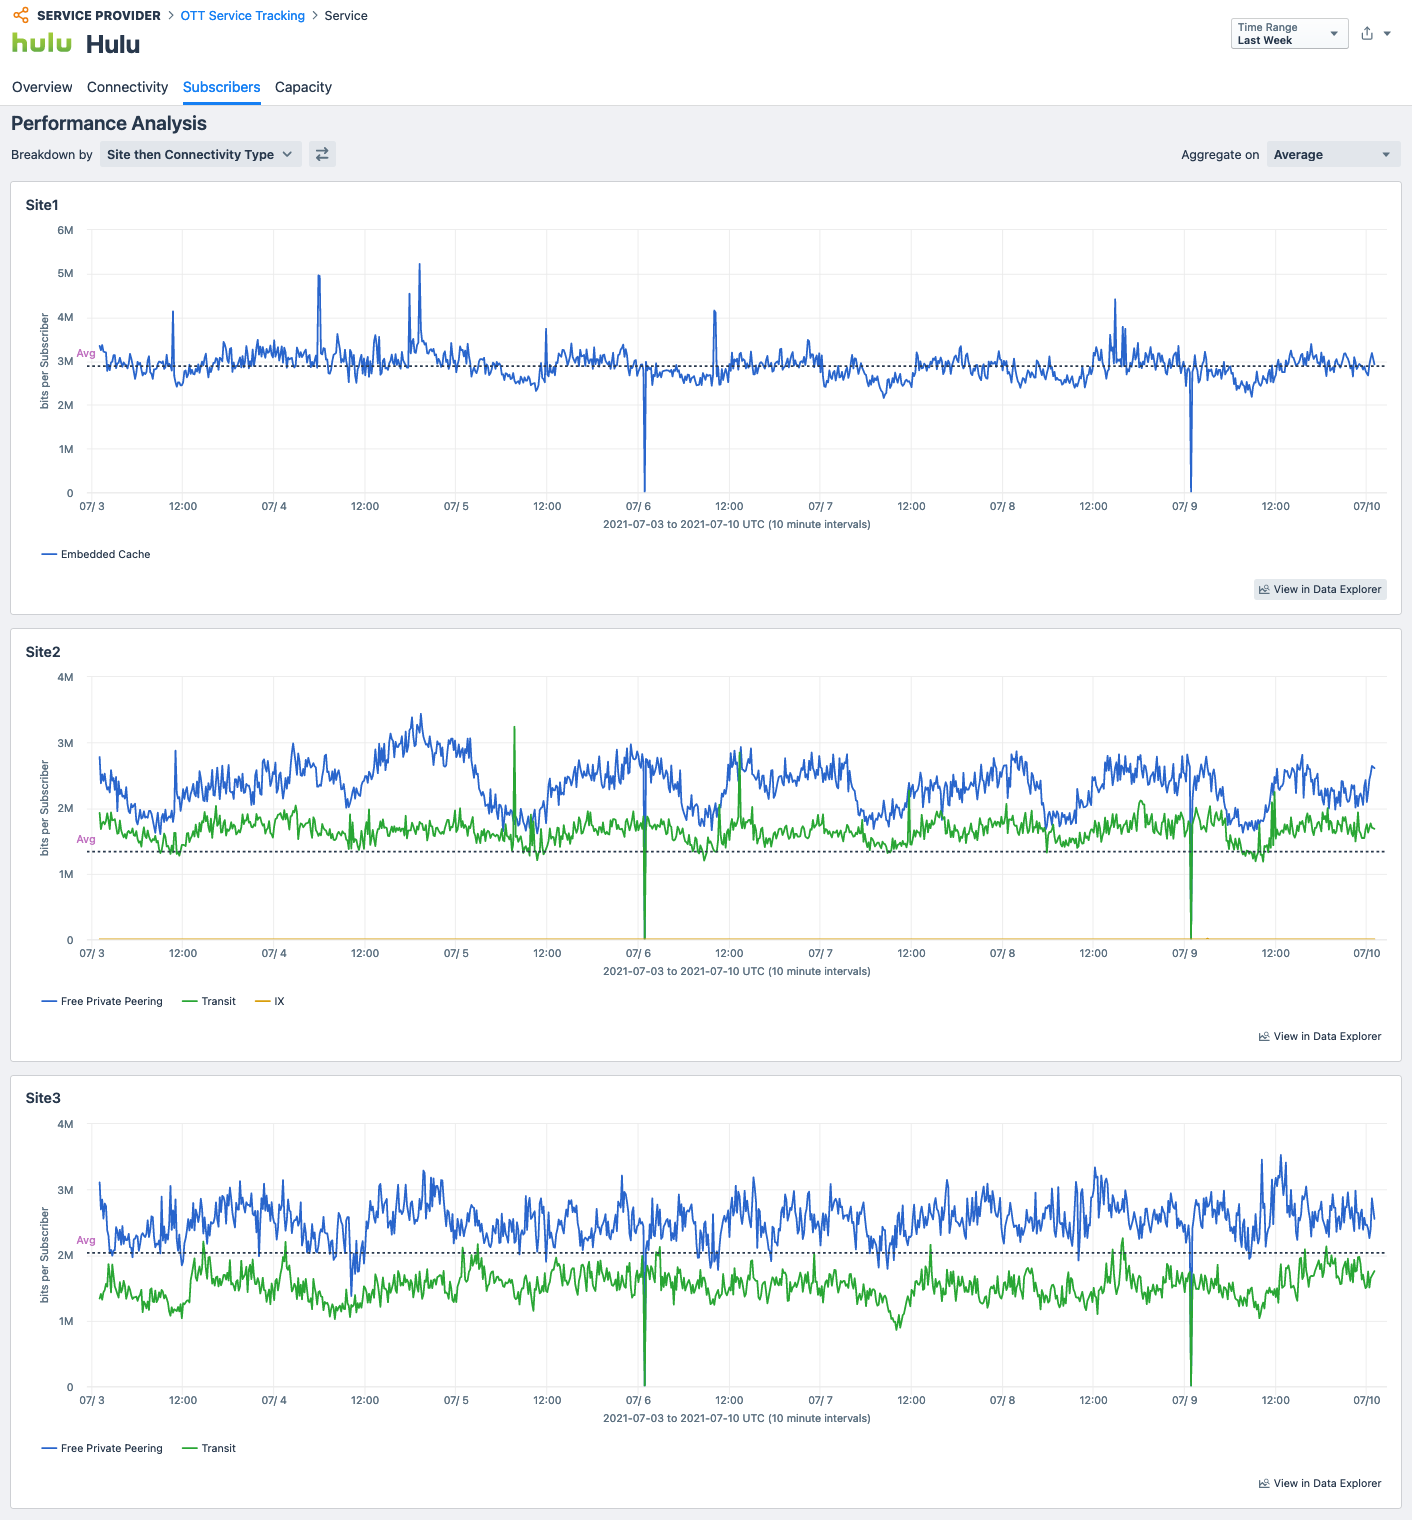
A good subscribership indicator can also be inferred by using the maximum number of destination IPs as a proxy. Granted, it will not help identify the number of members of a household with separate accounts on the same OTT service, but it is largely accepted as a sufficient proxy.
Tracking Edge Capacity for Individual OTT Services
Let’s look at the most exciting part of this update to our OTT workflow. As we’ve hinted in the past when talking about the vision behind Kentik, there are three standard aspects of a network on which any infrastructure engineer is usually focused.
-
Cost: We’ve started addressing this side of the equation in the previous quarter’s highly anticipated Connectivity Costs update. (Stay tuned, we have more coming!)
-
Performance: We’ve added a wealth of functionality in multiple areas of the product in the previously mentioned update and through our autonomous synthetic testing for CDNs.
-
Resilience / Capacity: While we already offer a pretty popular workflow for capacity planning, we heard from a number of broadband provider customers another request: “What if I want to scorecard an OTT service based on how much capacity I have on the edge?”
As we’ve learned early in this blog post, any given OTT service can leverage a myriad of interfaces to enter the broadband provider’s network. The more interfaces involved in traffic handover, the more difficult it is for the network operations teams to achieve a complete picture of capacity at any point in time.
The aggravating factor here is that the set of inbound interfaces receiving this specific OTT traffic are constantly changing because of routing policy changes from upstream players in the digital supply chain.
Together with this new requirement from our ISP customers, we have also heard these requests:
- “I want to be able to quickly evaluate/scorecard capacity at an OTT service level.”
- “In case deeper inspection is warranted, I want to be able to assess whether there is a performance impact on my subscribers.”
- “In the event of a meaningful performance impact, I want to be able to measure the ‘blast radius’ in terms of number of subscribers affected.”
With our latest OTT Service Tracking update, broadband providers get an improved ability to track capacity closely for any of their top-100 ranked OTT services, and get a better shot at zeroing in on potential issues.
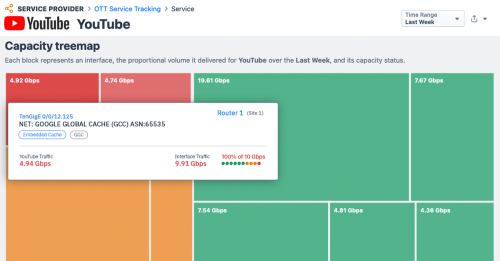
The workflow has been extended with a “Capacity” tab on the details screen of any OTT Service. In this screen, an easy-to-parse Treemap visualization gives the operator an instant view of all the interfaces involved in delivering the OTT service, together with a visual representation of the state of utilization and the weight each in terms of traffic. The user will get an immediate sense of what’s bad and how bad it is. See as follows:

- Each block represents an interface.
- The color of each block represents the state of utilization of the interface (utilization thresholds are configurable globally for the workflow).
- The size of each interface block represents the share of traffic for this OTT service that the interface is contributing to the entire distribution.
Below this capacity overview is a list of network devices that these interfaces belong to. Each one of these is expandable, providing a quick reference to all interfaces on the device, their state of utilization, and contribution to this OTT on the related network device.
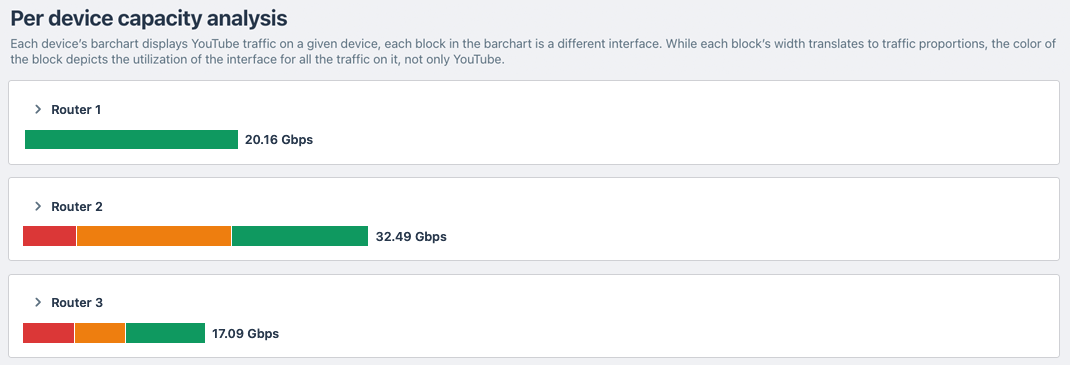
The user is encouraged to drill down into a device exhibiting high utilization to identify the over-utilized interfaces:

Now that the problematic interfaces are identified, you can further drill down to measure the potential impacts, as well as the amount of subscribers behind it:

Voilà! That’s our improved OTT Service Tracking tool!
What’s Next?
At Kentik, we design features and workflows with two key ingredients: the time-tested framework of cost, performance and resilience, and the inputs from our customers.
We start with ideas for workflows that you suggest and help us design. We put them in our customers’ hands to play with and improve them with each consecutive release. So, in a nutshell, you tell us what comes next.
Would you like to know how much any OTT service costs you? Or does something else keep your teams up at night? Just tell us. Our product team is thrilled to help you solve these problems.

