Package Tracking for the Internet
Summary
Without package tracking, FedEx wouldn’t know how directly a package got to its destination or how to improve service and efficiency. 25 years into the commercial Internet, most service providers find themselves in just that situation, with no easy way to tell where an individual customer’s traffic exited the network. With Kentik Detect’s new Ultimate Exit feature, those days are over. Learn how Kentik’s per-customer traffic breakdown gives providers a competitive edge.
Kentik Introduces BGP Ultimate Exit Traffic Analysis
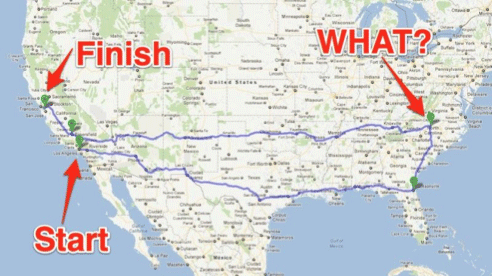
Imagine for a second what FedEx would be like without package tracking. Generally speaking, packages would probably still be delivered reliably, but sometimes before a package reached its ultimate destination it would be sent all over the map to get where it’s going. Or maybe that would happen more than just “sometimes.” Without the visibility and analytics provided by tracking data, there would be no way to know, nor any way to leverage that data to improve delivery times, reduce cost, or allocate load across the paths and system components that serve various customers.
Carriers, transit providers, and other entities that generate revenue by delivering IP traffic on behalf of others are in many ways analogous to FedEx. But believe it or not, many of these services have been operating for 25 years now — since the advent of the commercial Internet — without the IP equivalent of package tracking. It’s not their fault, but rather a reflection of what’s been available to do the job. Until now, neither existing commercial options nor hand-built in-house systems have been able to address more than bits and pieces of what providers need.

Effective tracking requires end-to-end understanding, and that’s the component that’s been especially hard to get. You need to be able to look at some subset of traffic entering the network on one side and see where and to whom that traffic exits on the other side. With that type of analysis you can quantify not only traffic volume but also traffic “distance.” The combination of those two metrics enables an operator to understand the “cost” for that traffic subset. Cost analysis at that level of granularity is one of the “holy grails” of network traffic analysis, having so far remained — like unobtanium — just beyond reach.
Kentik’s release of “Ultimate Exit” functionality changes all that, bringing the seemingly unobtainable not only within reach but — even better — within the framework of a powerful, comprehensive network traffic visibility solution. In a nutshell, Ultimate Exit uses BGP to enhance every flow record (NetFlow, sFlow, IPFIX, etc.) ingested into the Kentik Data Engine with two new fields that represent the Device (router) and Site (PoP) where that flow will exit the network to an adjacent autonomous system (AS). That enables service providers using Kentik Detect to answer a key business question: where and in what quantity is a particular customer’s traffic traversing our network?
Using Ultimate Exit
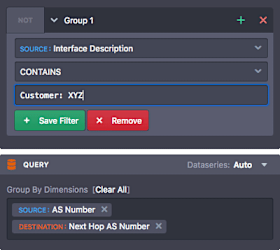
Now that we understand how valuable end-to-end traffic tracking can be, let’s take a practical use case and see how Ultimate Exit is used in the Kentik Detect portal. We’ll assume that the interfaces everywhere across our network are appropriately labeled to indicate the customer to which they’re connected. That allows us, using the Filter pane in the Data Explorer sidebar (shown in part at upper right) to use a simple Interface Description filter to select all of the traffic entering the network from a particular customer (regardless of how many interfaces are involved).
In the sidebar’s Query pane, meanwhile, we can use the dimension selector (shown at lower right) to group the matching traffic by source ASN and next-hop (adjacent) ASN. Also, we’ll set the display type (in the Display pane) to render the results as a Sankey Flow Diagram, which is a particularly useful visualization for this type of analysis. When we click Apply Changes, the diagram below will return within a couple of seconds.
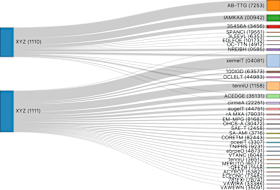
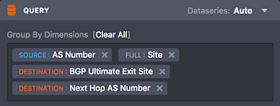
This Sankey diagram answers the “to whom” part of the question, and to be fair, that’s something that existing solutions might be able to do as well. The diagram also shows us that Customer XYZ sends us traffic from two different ASNs (1110 and 1111). Even so, key information is missing. We can’t yet see where (geographically or topologically) the traffic from XYZ is entering the network, and we also can’t see where it egresses to the next hop. As shown in the Query pane at right, we can fix this by adding a couple more dimensions to our view. Applying these changes, the diagram will be updated almost instantly.
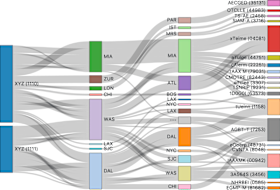
Now we can see not only source ASN and next-hop ASN, but also the distribution of traffic across the ingress sites/PoPs (in the 2nd column), and for each of those, the distribution across the egress sites/PoPs (in the 3rd column). Mousing over different parts of the diagram helps us understand that, in this case, traffic is being accepted and delivered relatively efficiently. For example, traffic entering the MIA PoP is egressing from the same PoP (MIA) and an adjacent PoP (ATL), not from PoPs on other continents.
Focusing with Filters

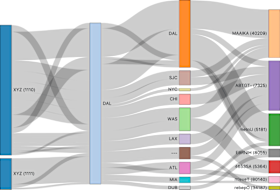
As with any Kentik visualization, we can easily add filters for further drill-down into details. Let’s say, for example, that we want to refocus the visualization to look only at the traffic entering the DAL PoP (bottom of column 2 in the Sankey diagram above). We can do so by adding a filter for that PoP (the second filter shown at right), which narrows the resulting Sankey diagram as shown below.
Ultimate Exit Use Cases
As we’ve seen from the above, Ultimate Exit gives Kentik Detect users a quite straightforward way to understand traffic patterns at the customer level. That’s nice, but what’s the business value of that information? One key use case, especially during contract negotiation, is to understand the relative cost of a given customer’s traffic. A customer whose traffic egresses mostly to domestic peers is going to cost a lot less than a customer whose traffic must be transported over a long haul transmission network. Arming your sales team with this insight provides a rational basis for the pricing of transit services, and gives you a serious leg up over competitors.
A key use case is to understand the relative cost of a given customer’s traffic.
Another major use case is network optimization and discovery/resolution of network misconfiguration. Ultimate Exit has already been used by a Kentik customer to discover that traffic from one of their downstream customers was egressing primarily via paid transit when it should have been egressing mostly via settlement-free peers. Correcting that misconfiguration led to an overall 30% reduction in paid IP transit traffic at one of their PoPs.
Enhancing each flow record with data about its exit router/site is just the beginning for the Ultimate Exit feature set. Our roadmap for the remainder of 2017 calls for several additional iterations, including the labeling of flows with exit interface information and allowing the operator to supply cost information for site-to-site pairs, so we can calculate true economic cost for any traffic subset.
Learn More With a Demo or Free Trial
Ultimate Exit is just one aspect of Kentik Detect’s comprehensive provider-friendly feature set for traffic analytics. To learn more, check out our product pages, then request a demo. Or dive right in with a free trial; in 15 minutes you can be exploring your own network traffic in the Kentik Detect portal.
