Kentik Blog


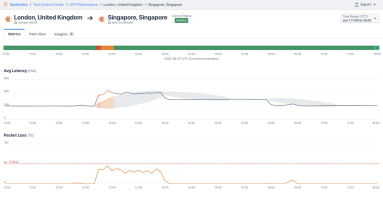
Kentik goes up the stack and launched Synthetic Transaction Monitoring (STM). Read this post to learn about enhancements to our synthetic testing capability and how to perform STM in Kentik.
The theme of augmenting the network engineer with diverse data and machine learning really took the main stage at the World of Solutions. Read Phil Gervasi’s recap.
On Tuesday, June 7, internet users in numerous countries from East Africa to the Middle East to South Asia experienced an hours-long degradation in service due to an outage at one of the internet’s most critical chokepoints: Egypt. In this blog post, we review some of the impacts as well as compare how this disruption affected connectivity within the three major public cloud providers.
By peeling back layers of your users’ interactions, you can investigate what’s going on in every aspect of their digital experience — from the network layer all the way to application.
With Kentik Synthetics, New Relic gains proactive insights about network performance and can ensure its customers have a reliable digital experience.
A critical milestone in any peering relationship is the business review; and when it comes to business reviews, it’s all about preparation. Learn how Kentik can help.
When something goes wrong with a service, engineers need much more than legacy network visibility to get a complete picture of the problem. Here’s how synthetic monitoring helps.
If you’re on the hook for the network that powers your organization, you may be hearing about network observability. This blog will help answer how network observability should become a part of your plans and what steps you can take.
Lorem ipsum dolor sit amet, consectetur adipiscing elit, sed do eiusmod tempor incididunt ut labore et dolore magna aliqua. Ut enim ad minim veniam, quis nostrud exercitation ullamco laboris nisi ut aliquip ex ea commodo consequat. Duis aute irure dolor in reprehenderit in voluptate velit esse cillum dolore eu fugiat nulla pariatur. Excepteur sint occaecat cupidatat non proident, sunt in culpa qui officia deserunt mollit anim id est laborum.
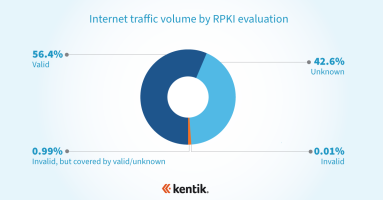
RPKI is the internet’s best defense against BGP hijacks. What is it? And how does it protect the majority of your outbound traffic from accidental BGP hijacks without posing a risk to legitimate traffic?
