Summary
Multi-cloud visibility is a challenge for most IT teams. It requires diverse telemetry and robust network observability to see your application traffic over networks you own, and networks you don’t. Kentik unifies telemetry from multiple cloud providers and the public internet into one place to give IT teams the ability to monitor and troubleshoot application performance across AWS, Azure, Google, and Oracle clouds, along with the public internet, for real-time and historical data analysis.
The adoption of the public cloud has progressed to the point that we don’t typically talk anymore about lifting and shifting workloads from our on-premises data centers to our preferred public cloud. Instead, IT teams have taken a step back to understand what services make the most sense in which cloud provider, even if they end up using multiple public clouds simultaneously. Multi-cloud environments are so common today that many of the applications we use daily rely on multiple public cloud vendors talking to each other. Usually, that’s over the public internet.
This is a huge advantage for IT teams trying to build a highly available and performant application delivery mechanism. However, it also makes the need for network observability that much more important. After all, if the applications we use every day depend on multiple public cloud providers and the public internet, how can we track down a performance problem when we don’t own most of the underlying infrastructure?
Cloud vendors provide some visibility into their own environment, which is helpful. However, in a multi-cloud environment, IT teams often use multiple disparate tools to understand an application’s path and performance over the network. Compound that with having to figure out what’s happening on the public internet, and you end up with some pretty frustrated engineers.
Network observability puts data into context
A pillar of network observability is unifying all of the telemetry we collect from various cloud and network sources into a single unified database. Metadata, routing tables, and synthetic testing results are also added to this database so that you can log into a single tool and filter for a single application, service, site, tag, or whatever is important to you.
Network observability is all about context, or in other words, understanding how multiple public clouds work together to deliver an application.
See all your networks in one place
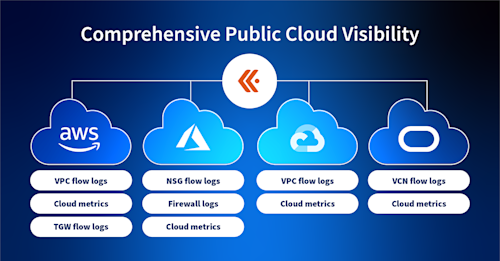
Kentik is cloud vendor-agnostic, ingesting telemetry from the major public clouds and the public internet. We collect flow logs and metrics from AWS, Azure, Google, and Oracle, and we trace paths on the public internet to understand network performance between cloud regions, providers, and your on-prem resources.
Multi-cloud environments rely on service providers, so we gather information from global routing tables and a worldwide mesh of synthetic tests to measure service provider availability and performance hop-by-hop.
We also monitor all the major clouds and their specific regions from strategically located vantage points around the world, so we have information about how entire cloud regions are performing in addition to your own cloud logs. This comprehensive approach leaves no part of your network in the dark.
From your own public cloud environments, we collect telemetry such as:

We also enrich this with relevant metadata such as application and security tags, geo-id, DNS information, etc. You can learn about cloud traffic volume, types, paths, and metrics such as packet loss on transit gateways, latency between clouds, and so on.
Let’s see what this actually looks like for an engineer logging into the Kentik Portal.
See everything in one place
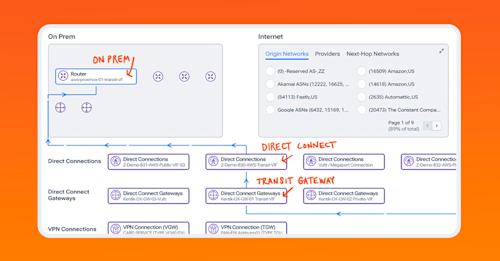
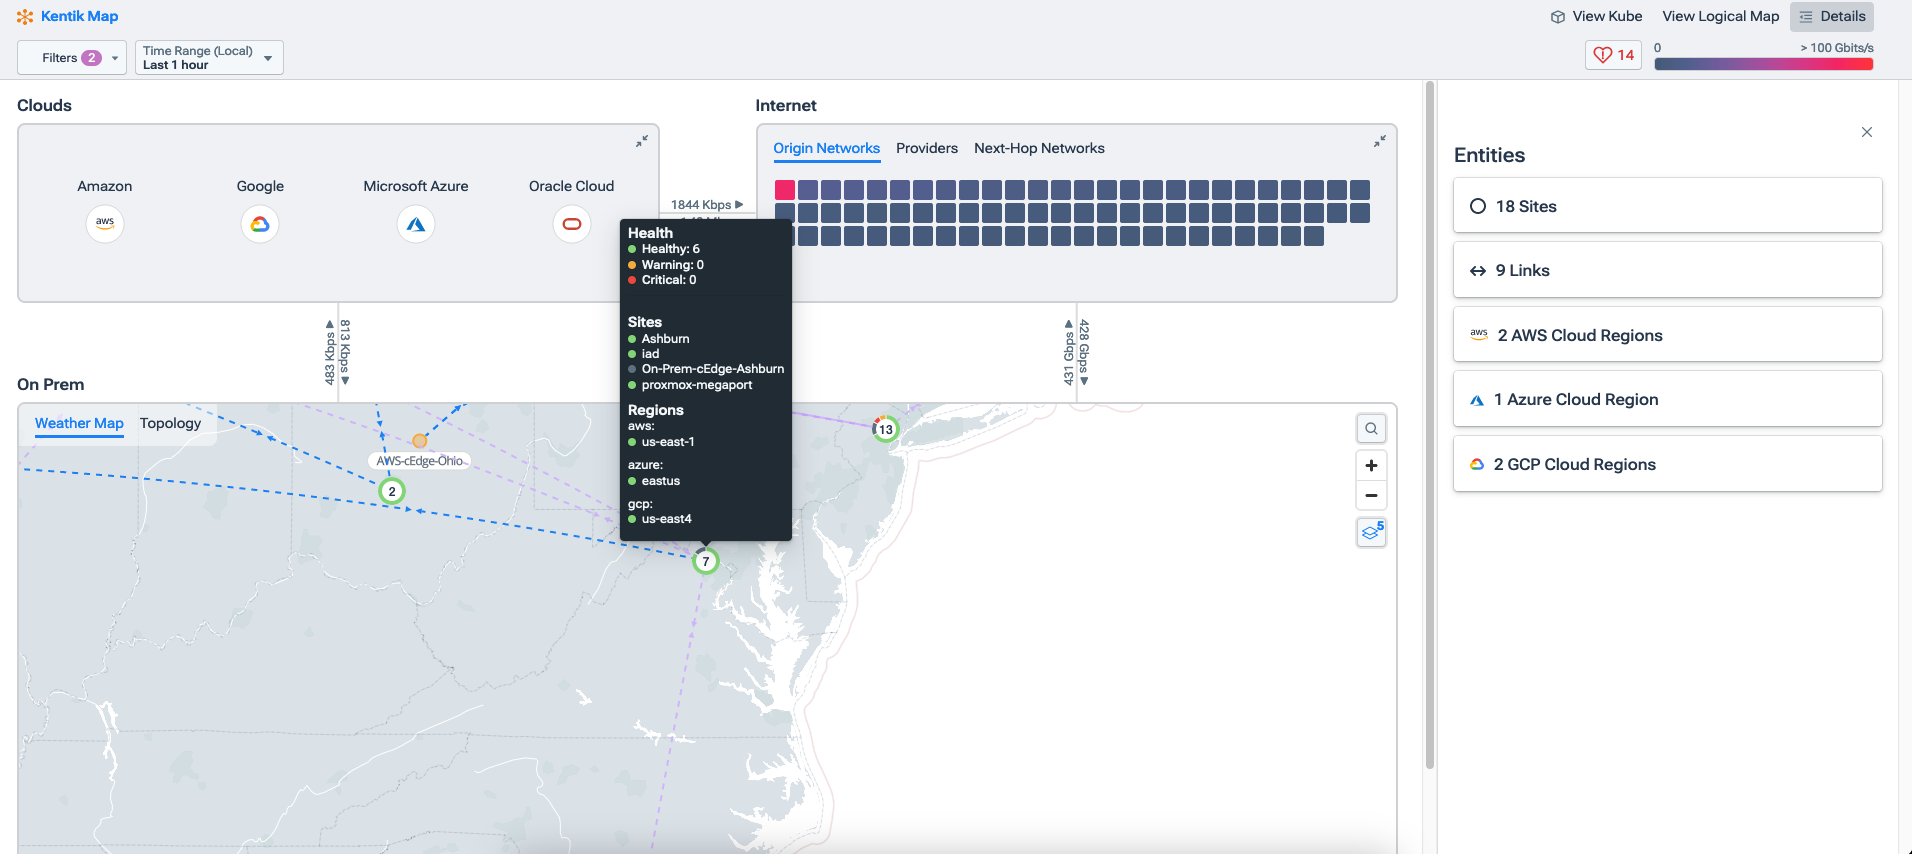
Notice the graphic below taken from the Kentik portal of the Kentik map, which includes all of our configured and discovered sites, both on-premises and public cloud. On one screen, you have a quick overview of all your active public clouds.

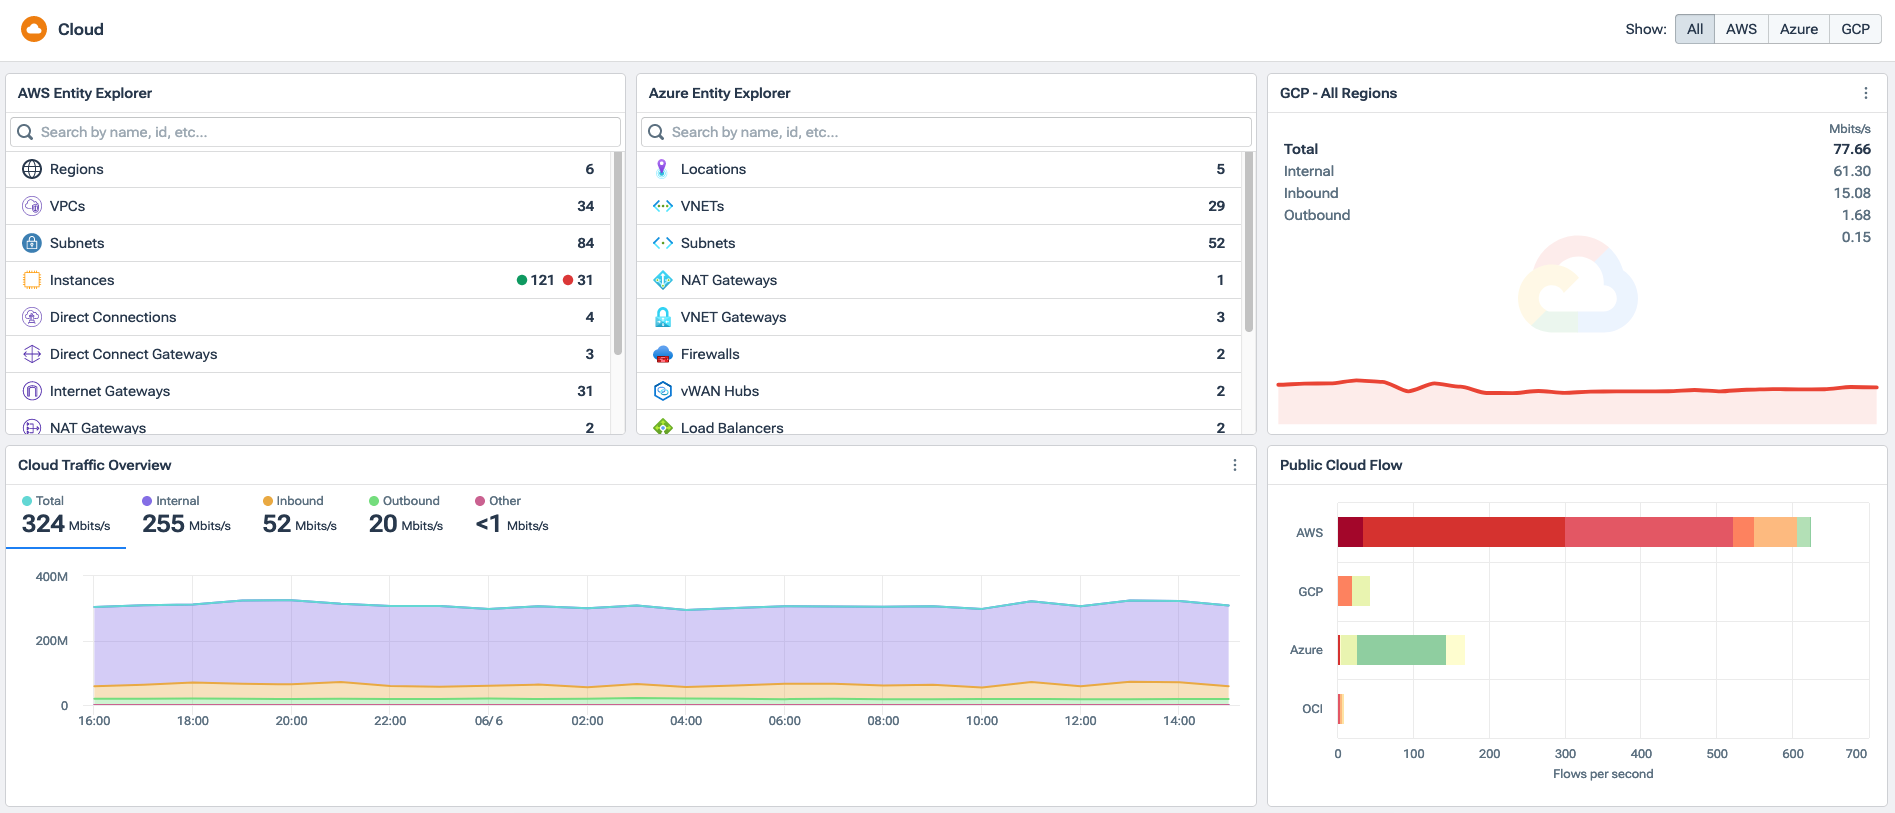
Kentik Cloud also provides an overview of the metrics and stats you care about on a dynamic dashboard. The image below shows some quick and basic information about our AWS, Azure, and Google environments on one screen. Dashboards are completely customizable, so instead of a breakdown of VPC and region, you can display important performance metrics, traffic volume, or whatever is important to your IT team.
Exploring all your cloud networking data
Whereas many visibility tools focus mainly on dashboards and graphs, Kentik ensures that the entire database of telemetry, from on-premises, public cloud, SaaS providers, metadata, and so on, can be easily and quickly interrogated in real time. This is critical for network and cloud operators in the trenches solving real problems.
To that end, most elements in the Kentik platform, whether that’s the Kentik Map, Cloud, or otherwise, are interactive, which means you can click on almost anything to get more information or pivot to another function, such as Data or Metrics Explorer. This makes it easy to go from an overview of all your cloud sites, for example, to specific application traffic between one data center and one VPC.
Take a look at the graphic below from the Cloud Performance monitor. Here, you can see how traffic, which we can filter for application, tag, IP address, and so on, flows from specific subnets in AWS US-WEST-1, through the transit gateway, direct connection, etc., all the way to your on-premises router. Clicking on a connection, device, or subnet automatically opens the details pane on the right side of the screen, which gives us vital information and more clickable elements to drill down even further.

When we start from the Kentik Map, hovering over a public cloud or a specific site on the map gives us more information and allows us to begin drilling down into the underlying data.
Filter data any way you need
To refine your search, we can select from a diverse set of filtering options. This is a powerful aspect of Kentik that sets it apart from legacy visibility solutions.
The screenshot below shows a very simple filter set up to search for MySQL traffic going between AWS US-WEST-2 and our Azure North Central US region. This is relatively simple for demonstration purposes, but in production, you can be more granular to suit the needs of your own environment.

When you need access to everything in the underlying database, we can also filter using Data Explorer, which gives us a powerful way to filter on-premises and cloud traffic alongside any other data we want to see with whatever visualization makes the most sense.
In the last image below, notice that we’re filtering for source and destination cloud provider, IP address, firewall action, and a specific timeframe. We can add more filters to see specific applications, customer tags, different time ranges, etc. Here, we can see traffic going from Azure to AWS, the specific IP addresses, the firewall action, and the volume of traffic.

Seeing the network in between public clouds
The network in between your public cloud instances is just as important as any other network our applications rely on. The problem is, the network in between public clouds is the public internet, which we don’t own or manage.
Using several methods including Paris Traceroute, Kentik is able to trace the path between two disparate public clouds accommodating any load balancing that’s likely occurring. Those metrics allow us to see information like packet loss, latency, and jitter hop-by-hop as application traffic travels node to node, provider to provider, and ASN to ASN. This gives IT teams a better end-to-end understanding of network performance and how it affects application delivery even when much of the delivery mechanism is the internet itself.
Notice in the image below we have a network mesh test between several AWS, Azure, and Google regions. In this case, we’ve deployed synthetic test agents to these regions and configured them to test connection and network performance to each other periodically. We can also deploy these agents in an organization’s cloud instances to test connectivity and network performance directly to the appropriate VPC, VNET, etc.
In the first image, we can see that over the last week there was trouble with the connection or performance between AWS US-WEST-1 and GCP US-WEST-1.

If we hover over that box, we can see that there was packet loss in one direction that triggered a warning alert.

We can drill into that specific issue by selecting View Details, which allows us to see these metrics over time as well as a path view of the hops between these two test agents. In the next screenshot, we can see, hop-by-hop, how traffic is moving between these two clouds including any problems like latency, etc. along the way.

The days of sitting in a cubicle from nine to five and accessing applications on servers literally down the hall in a campus data center are all but over. Today, most organizations are running multiple cloud providers, juggling multiple cloud visibility tools, and often struggling to piece it all together. Kentik ingests it all and puts it into context so that IT teams can see all their clouds in one place.

