Summary
NMS can do so much that one blog topic triggered an idea for another, and another, and here we are, six posts later and I haven’t explained how to install NMS yet. The time for that post has come.
Introduction
The saying “nobody likes a know-it-all” applies equally well to blog series – they’re really not terribly loveable. That goes double for a deep-dive technical blog series. We, who make our livelihood and career in tech, appreciate in-depth information and tutorials. But if a post has “part 8 of 33” in the title, it’s a safe bet that most folks will scroll right by because who wants to make that kind of commitment?
I share this with you to explain that I never intended to create a blog series on using Kentik NMS. My goal was to share what I knew about Kentik’s newest addition to the platform, and to do so in a way that was focused and easy to consume in a reasonable amount of time.
But there’s so dang much that NMS can do! One topic triggered an idea for another, and another, and here we are, six posts later, and I haven’t really gone into the details of how to install NMS yet.
I’ll admit the oversight – not starting with the NMS installation – was (slightly) intentional. I’m tired of slogging through 30 paragraphs covering “how to install” before I even know if the tool I’m reading about does anything I need or care about. So, I made the conscious decision to start by digging into the useful features and circle back to installation once I felt NMS had proven its worth.
That time has come.
Is it time to migrate to a modern network monitoring system?
Observations* on the NMS architecture
(*You see what I did there, right?)
I’m not going to belabor the overall design of NMS with a bunch of “…color glossy photographs with circles and arrows and a paragraph on the back of each one explaining what each one was…” (hat tip to Arlo Guthrie) because it’s pretty simple:
- The targets: This is the stuff you want to monitor – network gear and servers that sit on-premises, in the cloud, or both.
- The Ranger Collector: A system – it can be physical, virtual, or nothing more than a host for a Docker container – that’s in the same logical network, so it’s able to receive data and pull metrics from the stuff you want to monitor.
- The Kentik platform: This is the system – located remotely from you and your devices – to which the Ranger Collector sends data.
Ok, maybe just one photograph:
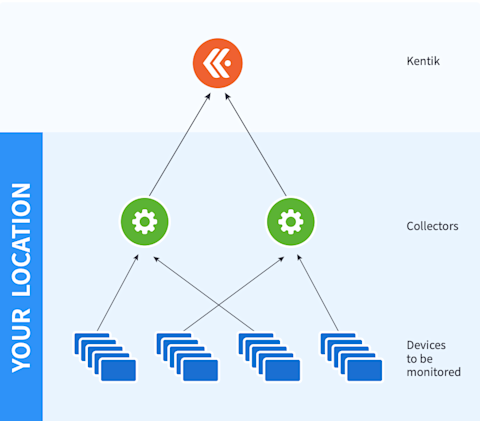
Measure twice, cut once

Eagle-eyed readers will note that I did, in fact, briefly touch on how to install Kentik NMS in both the NMS migration guide and also the blog Getting Started With Kentik NMS. This blog will go into far greater detail than those two, but I will still use bits from other blogs if they work well. Back in “Getting Started…” I wrote:
There’s nothing more frustrating than being ready to test out a new piece of technology and then finding out you’re not prepared. So before you head down to the “Installation and configuration” section, make sure you have the following things in hand:
- A system to install the Kentik NMS collector on. The collector is an agent that can be installed directly onto a Linux-based system or as a Docker container. Per the Kentik Knowledge Base instructions, you’ll want a system with at least a single core and 4GB of RAM.
- Verify the system can access the required remote sites:
- Docker Hub
- TCP 443 to grpc.api.kentik.com (or kentik.eu for Europe)
- Verify the system can access the devices you want to monitor:
- Ping (ICMP)
- SNMP (UDP port 161)
- Check that you have the following information for the devices you want to monitor:
- A list of IP addresses and/or one or more CIDR notated subnets (example: 192.168.1.0/24)
- The SNMP v2c read-only community string and/or SNMP version 3 username, authentication type and passphrase, privacy type and passphrase.
- You have a Kentik account. If you are just testing NMS, we recommend not using an existing production account. If you don’t, head over to https://portal.kentik.com/login and get one set up.
Once you’ve got all of your technical ducks in a row (which, to be honest, shouldn’t take that long), you’re ready to get started on this NMS adventure!
That about sums it up. To get NMS up and running, you just need:
- A system to install the collector on
- Systems to monitor
And with that, you’re ready to get installing.
Installing Kentik NMS
As I mentioned earlier, there are two primary options for installing the Kentik NMS Ranger Collector: direct or Docker. I will cover both, but regardless of which one you plan to use, you’ll start in the Kentik portal. Click the “hamburger menu” (the three lines in the upper left corner), which shows the full portal menu:
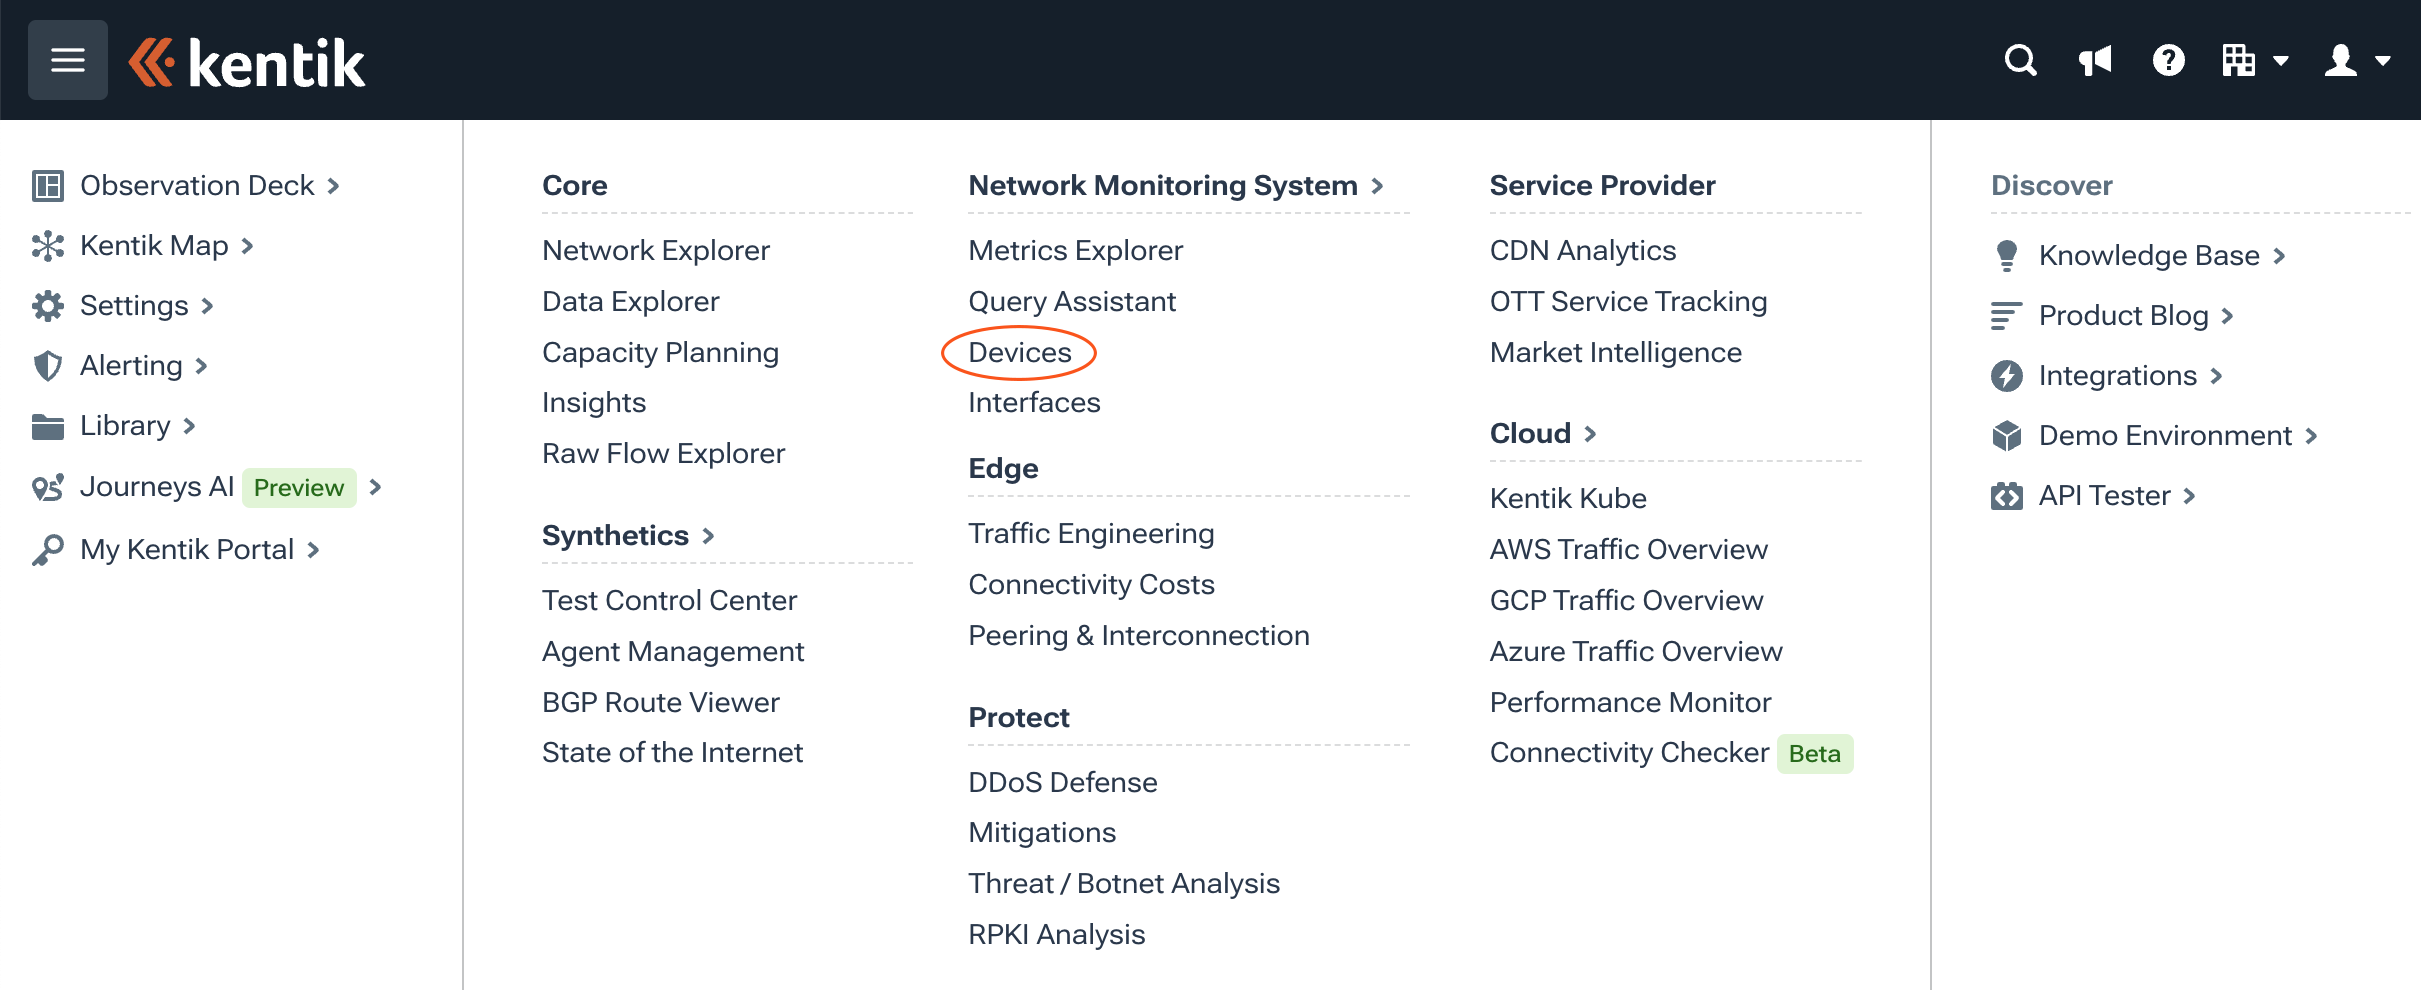

Click “Devices” and then click the friendly blue “Discover Devices” button in the upper right corner.
There’s a quick question on whether you want full monitoring or “ping-only” – just to know if systems are up or down:
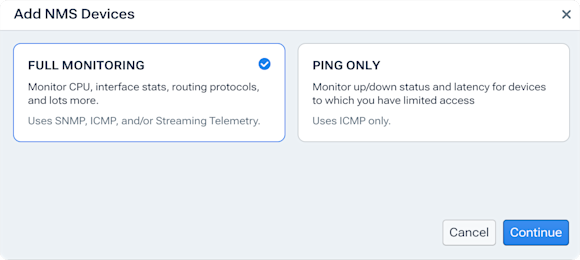
The next screen allows you to install the collector, either as a Docker container:

Or on a full Linux system:

Installing direct
Let’s start with a “direct” installation on a regular Linux system. Again, this can be an actual bare-metal server or a VM on-site or in the cloud. The only requirement is that the machine you’re installing on can access the systems you want to monitor.
Copy the command from the portal, SSH to the target system, and paste that command. (Note: You must have sudo permission to run this command.)
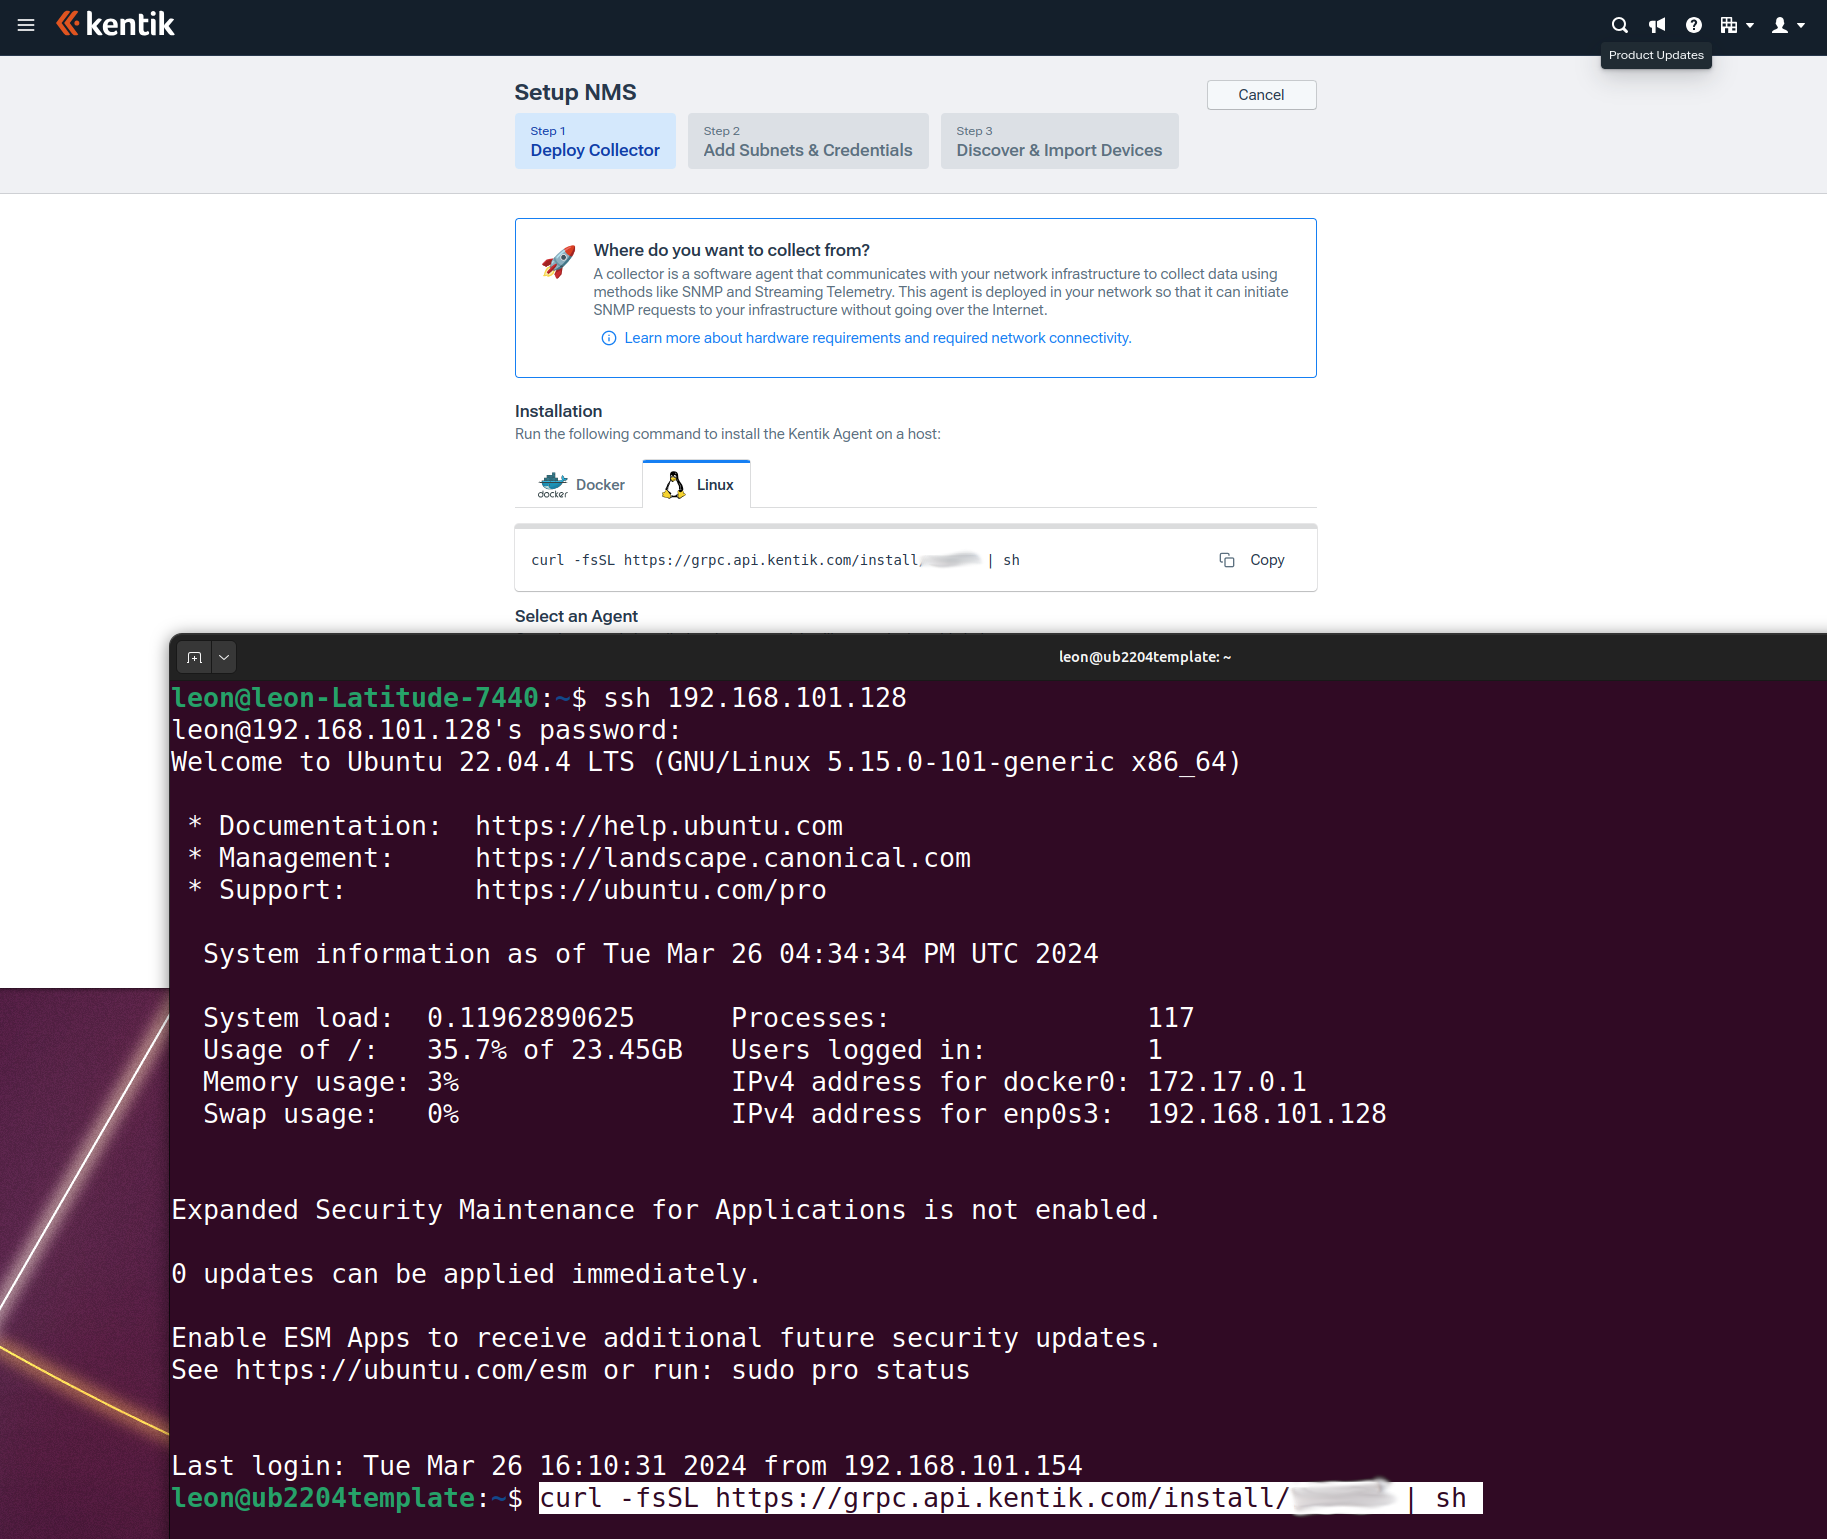
The installer will complete and… well, in most cases, that’s pretty much it.

No, really. That’s it. The next step involves getting things set up in the Kentik portal, so I will leave that aside for now.
Installing with Docker
This process starts out the same as with the Direct option – copy the command from the Kentik portal, SSH to the system hosting the Docker container, and paste.
However… there are a couple of implicit expectations that are worth stating out loud:
- The system you’re using already has Docker and all its necessary components installed.
- The user under which you’re installing has full permission to create, run, shut down, and update docker containers.
Presuming that’s the case, cut, paste, and run!

Once the Docker run command completes, there’s not much to see:

Scanning and adding devices (aka: the fun part)
Shortly after installing the Ranger Collector, you’ll see the agent name (or the name of the system the agent is installed on) show up in the “Select an Agent” area below the installation commands:

Go ahead and click “Use this Agent.” That will automatically authorize it and take you to the next screen, where you can specify the devices you want to monitor. From the next screen, you’ll enter an IP address, a comma-separated list of IPs, or a CIDR-noted range (example: 192.168.1.0/24).

Trick: You can mix and match, including individual IPs and CIDR ranges.
Another trick: if there are specific systems you want to ignore, list them with a minus (-) in front.
Presuming this is your first time adding devices, you’ll probably have to click “Add New Credential.”


Let’s get this out of the way: You will never select SNMP v1. Just don’t.
That said, select SNMP v2c or v3, include the relevant credentials, give it a unique name, and click “Add Credential.”
Then select it from the previous screen.
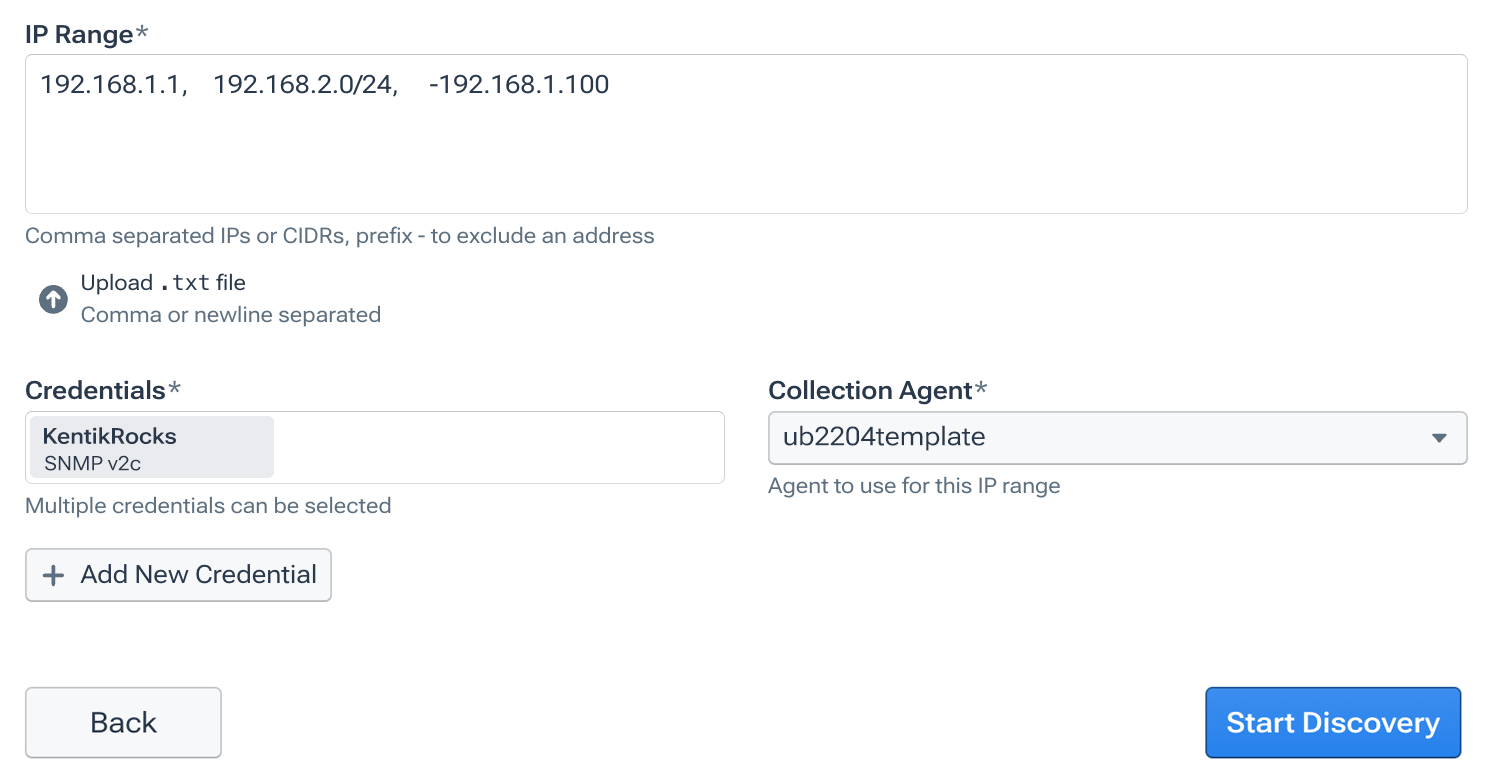
At that point, click “Start Discovery” to kick off the real excitement.
The collector will start pinging devices and ensuring they respond to SNMP. Once completed, you’ll see a list of devices. You can check/uncheck the ones you want to monitor and click “Add Devices.”

Docker for the distracted
I don’t want to presume that every reader is already familiar – let alone comfortable – with Docker and its basic commands. I recognize that there are a lot of Docker tutorials on the internet. In fact, I’ve lost several weeks of my life looking for (and at) them. But I also recognize that not every reader of this blog manages swarms of containers. So here’s the absolute minimum information you’ll need to be able to maintain your Ranger collector Docker container.
You can see which containers are running (along with their container IDs) with the following command:
docker ps

You can see an output of what a Docker container is doing with this command like this:
docker logs --follow <container id>
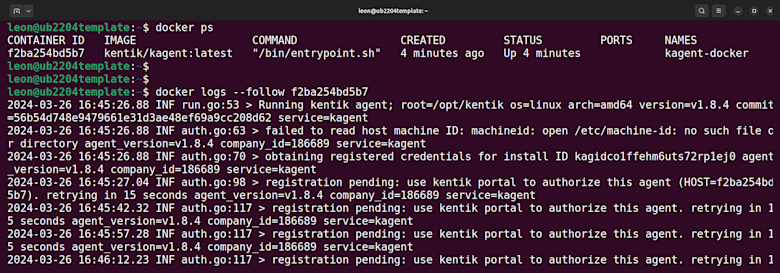
If you have issues with any containers, including the command to build or run the Kentik agent, you can easily stop a container with this command:
docker stop <container id>

Once a container is stopped, you probably will want to restart it. The problem is that it won’t show up using docker ps. To see containers that are no longer running, use the -a (“all”) switch:
docker ps -a

And then, to start that container again, run:
docker start <container id>

If something has gone horribly wrong, you can stop and then completely remove the container. (Warning: You’ll need to go back into the Kentik portal and re-run the original command to rebuild it, re-authenticate it, and add devices to be monitored by it.)
docker rm <container id>

Variety (and customization) is the spice of life
If you’ve been following along in the blog series, you’ll know that you can add custom SNMP metrics along with the ones collected by default. To do that, you need to create certain files and make them discoverable by the NMS Ranger Collector agent when it starts up. Whether you’re using the direct or Docker version of the agent, do the following:
- Create the directory:
/opt/kentik/components/ranger/local/config. If you’re running the direct agent, everything up to “ranger” will already be there, but you’ll have to create local/config. - In that directory, create three directories:
- /profiles
- /reports
- /sources
- Make the user:group “kentik:kentik” the owner of everything you just created and all the files and directories beneath it.
sudo chown -R kentik:kentik /opt/kentik/components/ranger/local/config
Note: You must monitor at least one device for /opt/kentik/components/ranger to exist.
Another note: If you add more files, you’ll probably need to re-issue that command.
Trick: You can also make this directory easier to get to by using the Linux “symbolic link” capability.
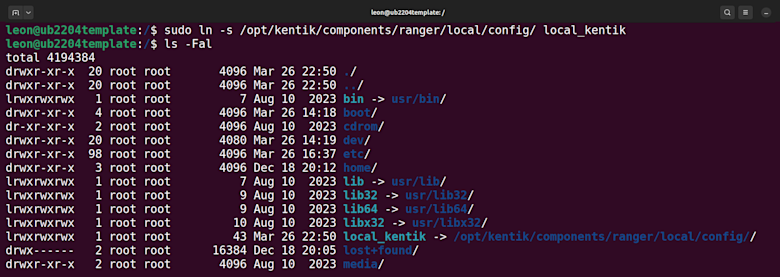
This would change the chown command to:
sudo chown -R kentik:kentik /local_kentik
You still need that directory for the Docker version of Kentik NMS, so do everything I described at the beginning of this section. But you’ll also need to tell Docker to mount it as a custom folder. To do that, we’ll start by looking at the “docker run” command that you used to install the container in the first place:
docker run --name=kagent --detach --restart unless-stopped
--pull=always --cap-add NET_RAW --env K_COMPANY_ID=1234567 --env
K_API_ROOT=grpc.api.kentik.com:443 --mount
source=kagent-data,target=/opt/kentik/ kentik/kagent:latest
Adding the custom folder means including the line:
-v /opt/kentik/components/ranger/local/config
…to the end of that command. Which would look like this:
docker run --name=kagent --detach --restart unless-stopped
--pull=always --cap-add NET_RAW --env K_COMPANY_ID=1234567 --env
K_API_ROOT=grpc.api.kentik.com:443 --mount
source=kagent-data,target=/opt/kentik/ kentik/kagent:latest -v /opt/kentik/components/ranger/local/config
But wait! If you used the symlink trick from earlier, the command line becomes slightly easier to manage:
docker run --name=kagent --detach --restart unless-stopped
--pull=always --cap-add NET_RAW --env K_COMPANY_ID=1234567 --env
K_API_ROOT=grpc.api.kentik.com:443 --mount
source=kagent-data,target=/opt/kentik/ kentik/kagent:latest -v /local_kentik
Troubleshooting and other swear words
Working in tech, we become used to the fact that things rarely go right the first time. Only through careful consideration, iteration, and correction can we achieve the result we initially envisioned.
This section is devoted to a few things that might not initially work as you hoped when setting up Kentik NMS.
Peeking behind the curtain
The Kentik Ranger Collector agent runs pretty silently during installation and afterward, which is usually a good thing. Still, when you suspect something is going wrong, it can be anything from slightly unsettling to downright rage-inducing. The good news is that most of the information you need is in the Linux Journal. The Linux Journal records every outbound message, error, update, whine, sigh, and grumble that your Linux system experiences – especially when it concerns services that run through the systemctl utility.
The command to peer inside the Journal is, appropriately enough, journalctl. But typing that by itself will likely yield a metric tonne of mostly irrelevant information. To see messages and output specific to Kentik NMS, you should use the command:
sudo journalctl -u kagent
What this is saying is, “Show me the Journal, but filter for the following UNIT (hence the “-u”), which is either the name of a service or a pattern to match. If that’s still too much information, try this:
sudo journalctl -u kagent –since "10 minutes ago"

That asks for the Journal to be filtered down to messages about the Kentik agent (“kagent”), specifically those that have appeared in the last 10 minutes.
If you want to see a running list of messages as they show up in the journal in real time, use this. The “-f” means “follow”:
sudo journalctl -f -u kagent
Meanwhile, if you have a Docker container, you can see what’s happening with Docker’s logs:
docker logs --follow <container id>

No devices are discovered
If you’ve installed the NMS Ranger Collector agent, authenticated it into the platform, and run a scan, and no devices have been found, obviously, something needs to be fixed. Here’s a short list of things that might have gone wrong:
You can’t reach the target devices.
This is hands-down the most common issue. Whether due to firewall issues or a simple routing oversight, it’s important to start by verifying that the machine on which you’re running the NMS Ranger Collector agent can talk to the devices you want to monitor.
Start off by running ping and ensuring you’ve got a clean response.

Next, make sure you can reach the device via SNMP. Here are the essential steps:
- On the system running the Ranger Collector agent, go to the command line/terminal.
- Type “snmp -V” (that’s a capital “V”) to verify that SNMP is installed on this system. If not, install it.
- Next, do an SNMPWALK on the system object ID, which is present on all devices that are running SNMP:
snmpwalk -v 2c -c <snmp community string> <device IP address> 1.3.6.1.2.1.1.2
If that works, you’ll see a response like this:

At this point, you’ll know a few things:
- If you can’t ping the device, you have a routing or firewall issue.
- If you can ping but can’t get SNMP information, then:
- The target device is refusing the SNMP request.
- Or it��’s not running SNMP.
- Or you need to correct some piece of information, like the community string.
Custom OIDs aren’t being collected
While this blog doesn’t get into it, a few other posts in this series delved deep into getting custom metrics and sending them to the Kentik platform. If that’s not working, here’s a list of things to check:
- Check the YAML files in an editor that shows the type of whitespace you’re using. Mixing spaces with tabs will never end well for anyone.
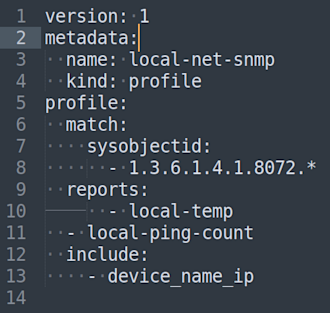
- Verify that all the files in /opt/kentik/components/ranger/local/config are owned by kentik:kentik.

- Verify that the custom files are the correct “kind” – profile, report, or source.
- Make sure the metadata name elements match up from file to file.
Red light, green light (stopping and starting)
Sometimes, the Kentik agent needs a good swift kick in the process. To do that, you can use the systemctl utility:
sudo systemctl stop kagent.servicesudo systemctl start kagent.servicesudo systemctl restart agent.service
Meanwhile, as discussed in the section on Docker, sometimes you need to restart the container itself:
docker psTo get a list of running containersdocker ps -aTo get a list of all containers (running or stopped)docker stop <container ID>To stop the containerdocker start <container ID>To start the containerdocker restart <container ID>To stop and start the container all at oncedocker rm <container ID>To delete the container- Note: You have to stop the container first
- Another note: All the systems monitored by this container will have to be re-added when you recreate it.
The end of the beginning
If you’ve arrived here after reading the previous posts on using Kentik NMS to troubleshoot, adding a single custom metric, adding multiple custom metrics, or modifying custom metrics before they’re sent to the Kentik platform, you now have everything you need to get the Kentik NMS Ranger Collector agent installed, running, and collecting monitoring data from your systems.
On the other hand, if you arrived here fresh from the internet and this is your first encounter with Kentik NMS, I invite you to use the links in the paragraph above to explore further.

