Using NetFlow Analysis to Optimize IP Transit
Summary
Unless you’re a Tier 1 provider, IP transit is a significant cost of providing Internet service or operating a digital business. To minimize the pain, your network monitoring tools would ideally show you historical route utilization and notify you before the traffic volume on any path triggers added fees. In this post we look at how Kentik Detect is able to do just that, and we show how our Data Explorer is used to drill down on the details of route utilization.
How BGP-enabled Visibility Cuts Transit Costs
Whoever said “there’s no such thing as a free lunch” might just as well have been speaking about the Internet. Getting traffic from place to place has a cost, and one way or another, someone has to pay. For the biggest of the big — the “Tier 1” service providers like AT&T, Verizon, NTT, TeliaSonera, and China Telecom — payment is effectively based on barter. Known in the trade as “settlement-free peering,” the deal is simple: you transport my traffic and I’ll transport yours. But if you’re an ISP without national or international scope, the big boys won’t let you into their select peering club. Instead you’ll be paying with actual money for at least for part of your access to the Internet. Needless to say, the less paid for these “IP transit services,” the better. This post will show you how Kentik Detect can help you keep those transit costs to a minimum.
A Vale of Tiers
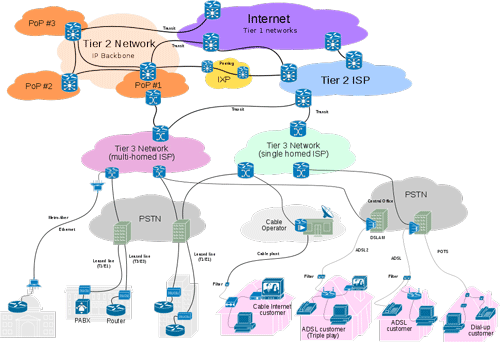
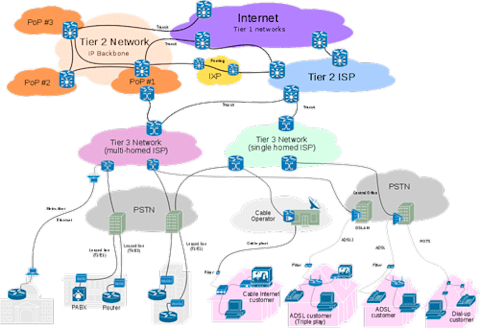
As noted above, the largest networks in the Internet (which is a network of networks) are the so-called Tier 1 service providers. All other networks in the Internet are connected, directly or indirectly, to one or another of the Tier 1s, so when the Tier 1s peer with one another they gain settlement-free access to every network on the Internet.
Below Tier 1s are the Tier 2 ISPs that are typically regional providers or national ISPs that haven’t joined the Tier 1 club. Tier 2 ISPs utilize a mix of settlement-free peering and IP transit services. Below them are the Tier 3 ISPs, which are typically small operators that provide services — local broadband, telecom, fixed wireless, and cable — to retail subscribers. Tier 3s purchase IP transit services, as do some digital businesses that depend on bandwidth to deliver content (e.g. music or gaming) or to maintain availability and transaction performance (e.g. e-commerce sites).
Whichever tier an organization belongs to, the IP transit services it buys are likely based on a Committed Information Rate (CIR), which is commonly metered based on “95th percentile.” Bursting above the CIR is billed extra (according to each provider’s formula), so a key way to minimize transit costs over time is to ensure that traffic volume stays (narrowly) within pre-committed ranges. But how? You need a path-aware traffic analytics system that shows traffic volumes on various routes, both historically, for planning, and in real time to detect transit links that are nearing their CIR so that you can take corrective action.
The traditional appliance-based, single-server approach to network monitoring, with its inherent limitations in ingest and compute power, falls short for this application because it’s underpowered for large-scale real-time detection and it also involves discarding most of the data you need for historical analysis. Kentik Detect, on the other hand, offers a scalable big data backend, BGP-enriched flow data, and a dedicated BGP Analytics section, all of which makes it ideally suited to enable your organization to avoid excess costs by optimizing IP transit utilization.
Checking Next Hop in Data Explorer
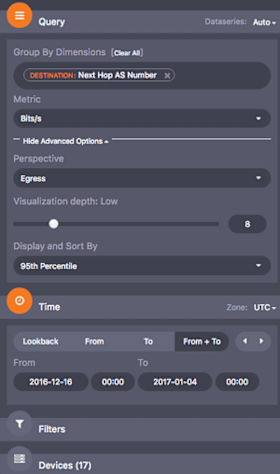
To see how Kentik Detect can help, let’s begin with the Data Explorer section of our portal. Data Explorer can be used to rapidly assess 95th percentile traffic levels over a specified time-range. Let’s assume, for example, that our billing period starts on the 16th of the month. In the screenshot below, we can see how we would set configuration options in the sidebar to assess our utilization in relation to our CIR:
- Set the group-by dimension to next hop AS number.
- For metric, use bits per second.
- For traffic perspective, choose egress.
- For display and sort by, choose 95th percentile.
- Set the time range from the 16th to the present date
- In the device selector, choose all relevant flow exporters (17).
As shown in the following graph and table, we can now see a stack-ranked set of 95th percentile, next hop ASN traffic volume.
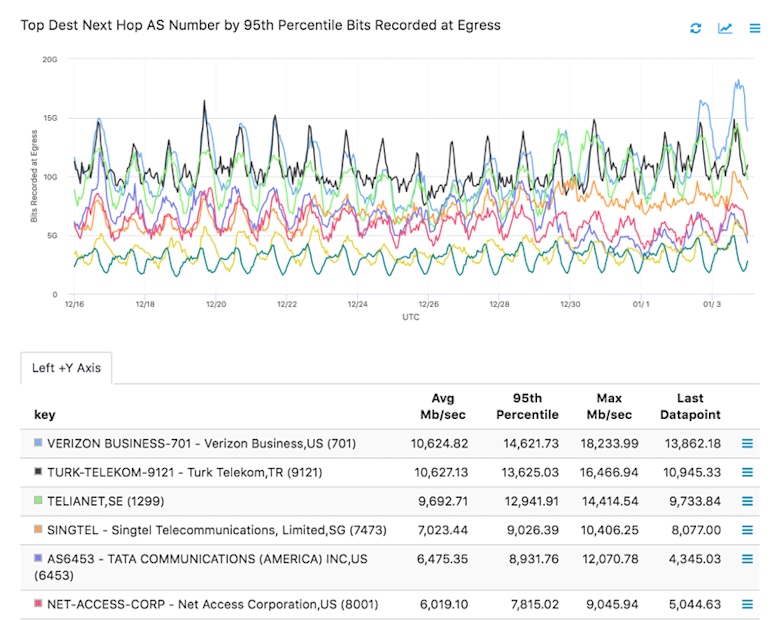
If the traffic volume for all paths is within the committed range, we’re good. However, if the volume on any path is getting close to the corresponding CIR then we would want to examine destination traffic from a highly used transit AS link to a less utilized one.

This analysis is pretty easy to do. Based on the above example, let’s say that Turk Telekom is nearing its commit level. We can rapidly create a Data Explorer analysis by adding destination ASN to our group-by dimensions and looking for destination ASN traffic that we might want to reroute.
With the added group-by dimension the resulting visualization looks like the following:
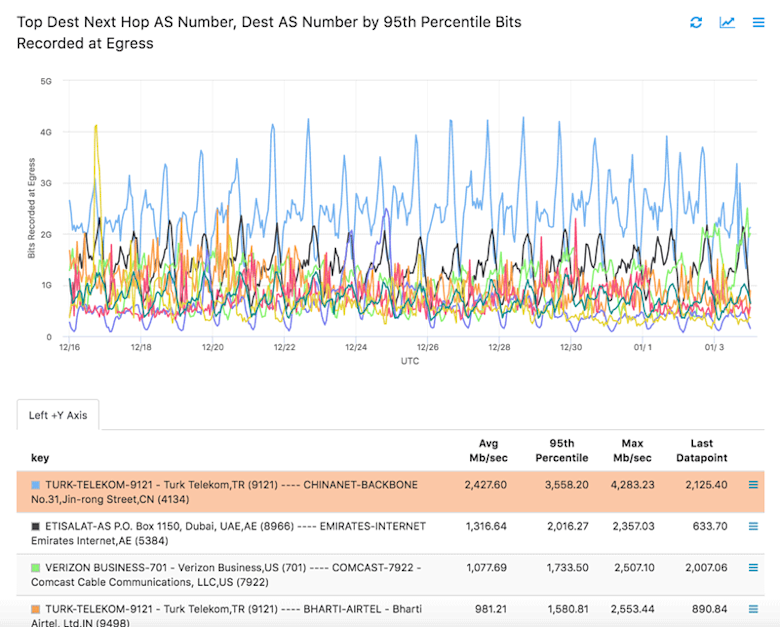
If needed, we could have filtered to just look at Turk Telekom, but it turns out that there are some destination ASN traffic flows that are easily spotted. From here, we can work on route maps to shift that traffic to another exit router and next hop ASN path.
Automated Traffic Rebalancing
One of the great things about Kentik Detect is that everything that you can do in the portal UI can also be done via SQL or REST. So it’s possible to run the above analysis on an automated basis by scripting queries via our APIs and using the top destination AS traffic information to automate router configurations so that traffic is rebalanced on a regular basis.
If you’re not quite sure that you need that sort of automation, you can find out by using our built-in alerting system. Configure alerts to look for 95th percentile traffic that is above your CIRs. If you regularly get notifications from these alerts, then it’s likely that the developer resources required to build an automated traffic rebalancing process would provide a solid return on investment.
Kentik Means Visibility
“Kentik” literally means visible in Yiddish (as discovered by Avi Freedman, our co-founder and CEO). Figuratively speaking, Kentik is here to give you new eyes: to provide you with the exact visibility you need to deliver a great network experience. That helps make your user and customer experience the best it can be, while also keeping a lid on your costs. If you’d like to learn more, check out the Kentik Detect product page and visit our NetFlow Analysis solutions page.
