Summary
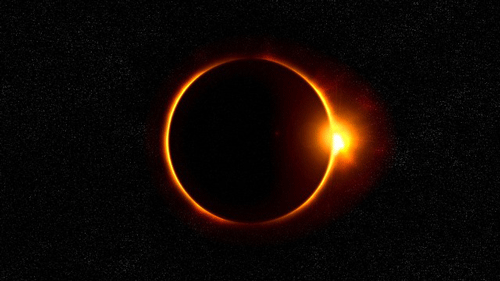
With much of the country looking skyward during the solar eclipse, you might wonder how much of an effect there was on network traffic. Was there a drastic drop as millions of watchers were briefly uncoupled from their screens? Or was that offset by a massive jump in live streaming and photo uploads? In this post we report on what we found using forensic analytics in Kentik Detect to slice traffic based on how and where usage patterns changed during the event.
Analyzing the Eclipse’s Impact on Internet Traffic
As many as 7.4 million people were expected to travel to the path of totality Monday to get a view of the Great American Eclipse. Millions more may have stayed in town but headed outside to see what they could see. With so many people away from their desktops, we had to wonder… What happened to network traffic in the US? Did legions of American workers step away from their desks to get a glimpse? Did students already back at school get an early recess to take it all in? As our fellow citizens ventured outside to watch the sun take second place, were enough of them off of the Internet to create a true digital eclipse? Or did our digital dependencies push us to post photos of the sky on social media and race to stream video from whatever feed best captured the event?
Since the nature of our business here at Kentik is network traffic intelligence, we had a good view of what the Internet looked like leading up to and through the eclipse’s totality. Looking at network traffic served up from Internet service providers (ISPs) and web companies here in the US (with their explicit permission), the pattern was analogous to the changes witnessed by those of us who weren’t in the path of totality: a partial digital eclipse. The networks we monitored around the time of the eclipse did not see outage-causing spikes in network traffic. But we did observe noticeable network activity… and it was enough to trigger traffic anomaly alerts for some of our customers.
Graphing Internet Traffic
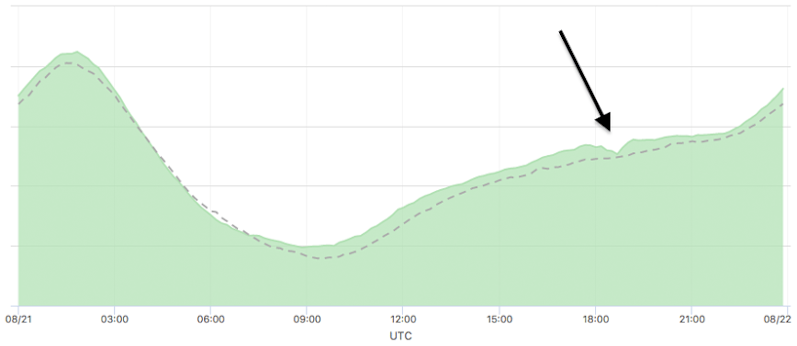
The graph below shows an ISP’s network traffic over a 24-hour span from Sunday to Monday evenings. Note the spike around 01:00 UTC (9:00 PM EDT) — that’s right when all of the Game of Thrones fans settled in for another shocking episode. Then traffic slowed while the East Coast slept. Later, as the eclipse came into view around 18:40 UTC (2:40 PM EDT) there was an obvious lull in network traffic, indicating that people may have temporarily stepped away from Internet-connected devices.
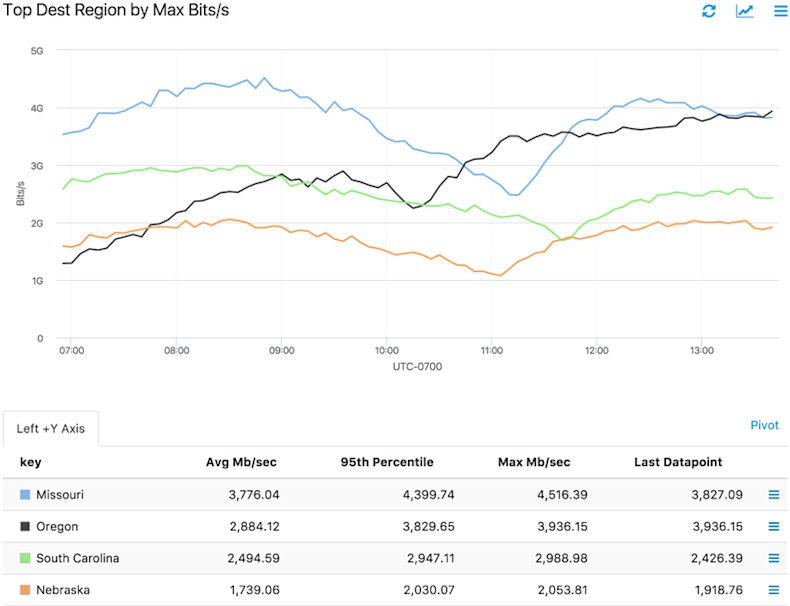
Another Kentik customer who serves content to consumers globally also saw traffic dip during the eclipse. For the chart below we filtered the results on a few specific geographies that were directly in the path of totality, and the time delta between locations is clearly visible as the eclipse moved West to East (all times PDT). In some locations, traffic volume fell by 50 percent.
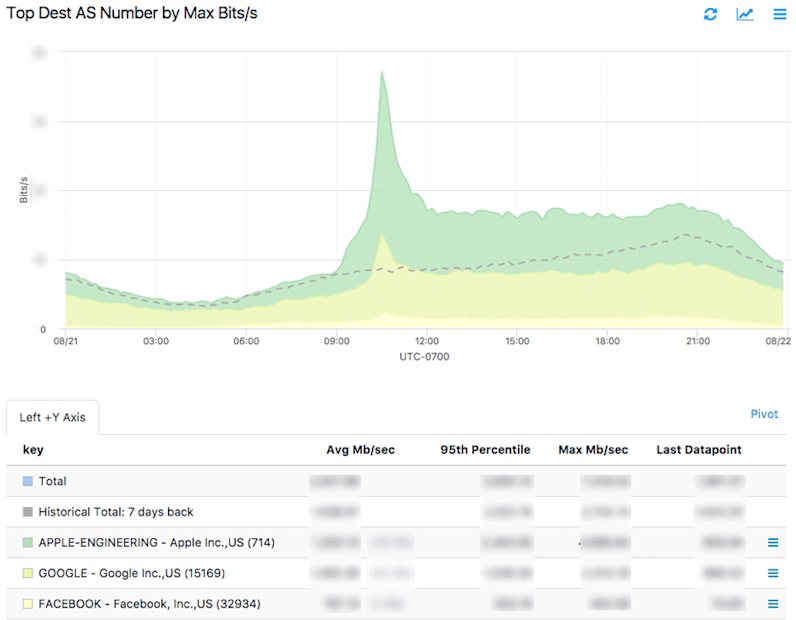
Lastly, the chart below shows traffic from another of our ISP customers as it exited from their network toward some large web companies (including Apple, Google, and Facebook) that deal with photos and other user-generated digital media. Many photo-taking eclipse-watchers were likely using phones set to automatically store photos to the cloud, and also posting those photos to social media. While we don’t look at actual user behaviors, our best bet based on the timing is that the spike represents a large number of photos being synced and uploaded simultaneously by the ISP’s customers. Even after the initial spike, the traffic remains elevated above the week-ago historical volume (dashed gray line) through the end of the day.
Preparing for the next one
If you didn’t make it to Monday’s path of totality, there’s good news from media outlet Vox: “Total solar eclipses happen somewhere in the world every 18 months or so.” That means you’ve got time to prepare for the next one. Similarly, most ISPs, telecommunications providers and web companies had time to prepare for Monday’s big event. AT&T, Verizon, and Sprint even deployed “Cell on Wheels” ahead of the eclipse to support overloaded networks.
Unfortunately, however, most events affecting access to and performance of the Internet aren’t so predictable. DDoS attacks drive unexpected traffic swarms that cause network outages. Big weather events and emergencies cause network latency that limits connectivity. New application deployments change traffic patterns and trigger unexpected behaviors in users and infrastructures. And even routine routing shifts, maintenance, and errors can cause outages for ISPs, cloud providers, and, ultimately, the businesses and end-users that rely on their services.
Maintaining service quality despite these unpredictable incidents requires the equivalent of eclipse glasses. You need to be able to see the details of events as soon as they begin to unfold, rapidly analyze causes and impacts, and initiate an informed response ASAP. That’s nearly impossible to do with the limited storage and compute power of legacy network monitoring systems. Kentik Detect, on the other hand, runs on a big data platform that is purpose-built to deliver real-time visibility and analytics at Internet scale.
To learn more about Kentik, request a demo or start a free trial today.

