Summary
Relentless traffic growth and a constant stream of new technologies, e.g. SDN and cloud interconnects, make it harder to understand how services traverse the network between application infrastructure and users or customers. In this post, we discuss how that led Kentik to build our BGP Ultimate Exit to help address traffic visibility challenges.
Let’s face it — today’s networks are complex. The physical topology continues to expand with relentless traffic growth, and a constant stream of new technologies like SDN, Clos architectures, and cloud interconnects make it even harder to understand how services traverse the network between application infrastructure and users or customers. Even simple questions like “where will this traffic exit my network?” become difficult to answer.
It’s that “exit point” question in particular that led Kentik to build our BGP Ultimate Exit feature set (UE for short). In a nutshell, UE enriches all the flow data Kentik receives with tags that indicate the PoP, router, interface, etc. where that flow will exit the network, potentially many hops away. For outbound traffic, the exit might be to an adjacent network, a customer, or an upstream provider. For inbound traffic, the “exit” might be to a host in a data center. In either case, UE is insanely valuable across both enterprise and service provider networks, for diagnosing routing issues, understanding which traffic sources are driving traffic growth at remote points in the network, or even understanding the relative cost to serve each customer.
To be clear, UE is fundamentally different than simply looking at traffic based on the typical source or destination fields available in regular NetFlow. To illustrate, let’s consider a network that looks roughly like the diagram below. Each network device (switch, router) in this network is sending data to Kentik (flow, BGP, and SNMP data).

As you can see, we have a network where traffic is entering an edge/border device destined for a host on the same network.
Based upon the flow generated from the border router, we can see that this flow is originating from 1.1.1.1 and headed towards 3.3.3.3. Looking at that same flow, we see that the source interface is the transit interface and the destination interface is the backbone interface connected to device B. We can figure all of this out just by using the standard fields in flow records exported from the edge device alone.
But what if you wanted to figure out which piece of network gear is actually handing this traffic off to the destination host (3.3.3.3)? If you don’t have a detailed mental map of your network (and honestly, who really does at this point?) the traditional approach is to log into a router, run a show route command to figure out which adjacent device is announcing the IP internally, then jumping to that device to look at ARP tables, figure out which interface the device is attached to, rinse and repeat.
BGP Ultimate Exit dramatically simplifies this by determining the egress point (err, the “ultimate exit”) at the exact moment that the traffic ingresses the first router. Kentik stitches together flow data, BGP routes and SNMP interface IP data to determine precisely where the traffic will be routed to without having to do any ‘flow hopping’ recursion lookups or logging into your routers. Here’s a quick sketch of how it works:
- As packets ingress the router, it performs lookups to determine how to forward the traffic and also creates a flow record which is exported to Kentik.
- Kentik’s ingest layer maintains a full BGP table from each router. By looking up the dest IP from the flow record in the BGP table for the router it was received from, we enrich each flow with additional BGP-related fields, including the BGP next-hop IP address for the matching route.
- Kentik’s ingest layer also maintains an SNMP interface IP table for every device in the network. By looking up the next-hop IP in this table, we can tag each flow with the egress router and site that the next-hop IP is associated with.
- Kentik also maintains an auto-generated in-memory table of the ASNs that are adjacent to each interface. Comparing each flow against this table allows us to additionally tag it with a specific egress interface.

As another example, imagine you wanted to see the destinations for content from a specific server or set of servers, and how that traffic was being delivered over your infrastructure. Perhaps you’re planning some network maintenance and want to detail the expected impact of your work. Kentik’s UE feature makes this easy. We’ll use the same diagram, but flip the arrows around:
Steps in the Kentik UI:
- Select all devices to make sure the query considers the entire network
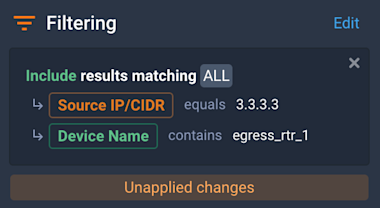
- Add filters to uniquely identify traffic from the server in question. For example, if you wanted to see where traffic from source IP 3.3.3.3 left your network, you’d set up your filters like so:

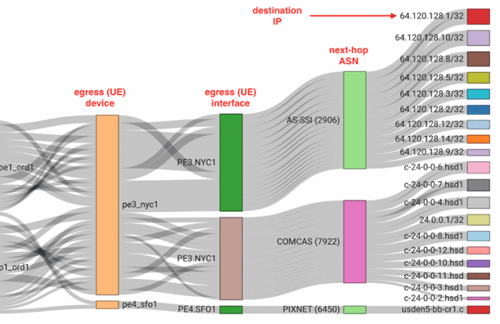
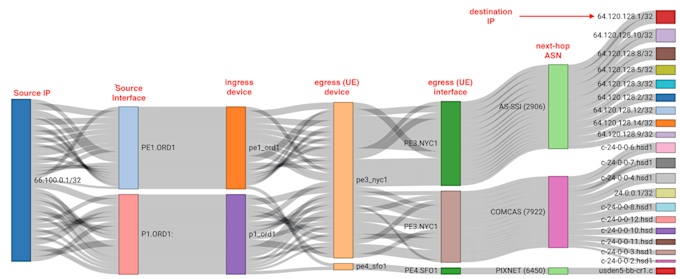
- Choose the dimensions to include in the query output. The example below is particularly useful, showing the network entry point(s) by source IP, source interface and ingress device, then the egress UE device and interface, together with the next-hop ASN and destination IP.

The output will be similar to the diagram below, showing the end-to-end flow of the traffic from that particular server:

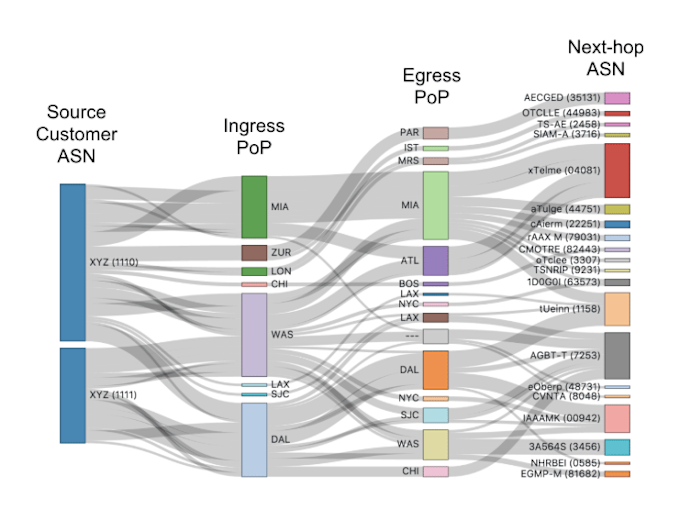
For service providers, UE can help sales and product teams understand how each customer impacts network load, and the relative cost of delivering each customer’s traffic. By applying filters for a customer’s ASN, interfaces, or subnets, the SP can get a view of how much of the customer’s traffic is delivered locally out of the same PoP or region where it ingressed, and how much traverses the SP’s backbone to egress in remote regions (with a much higher associated cost). This type of visibility allows product teams to create differentiated pricing structures, calculate margin for each customer, and enforce contracts with “traffic distance” terms.

As you can see Kentik’s BGP Ultimate Exit feature set provides key functionality for understanding and managing traffic flows in networks of all types.
Not already a Kentik customer? Start leveraging the powerful visualizations in Kentik Detect today by requesting a demo or signing up for a free trial.
