Summary
Adding more bandwidth from the business to the cloud is like adding more cowbell to Grazing in the Grass. In many cases, it won’t improve the end-user experience when latency is the real problem.
Latency is not a new problem in networking. It has been around since the very first connections were being made between computer devices. It’s actually a relic of an issue that was recognized as a problem before the introduction of the ping utility, which was invented by Mike Muuss back in 1983. Yeah, that’s approaching 40 years.
The challenge with fixing the latency problem is that it is difficult. Not as difficult as time travel, but it’s difficult enough so that for 30+ years IT professionals have tried to skirt the issue by adding more bandwidth between locations or by rolling out faster routers and switches. Application developers have also figured out clever ways of working around network latency problems, but there are limits to what can be done.
Given that almost all traffic is headed to the cloud these days, adding bandwidth to a business or a home office is like adding more cowbell to Grazing in the Grass (a popular song from 1968). In many cases, it won’t improve the end-user experience.
Latency is a difficult problem to solve. Over the last few decades network managers have focused on adding bandwidth and reducing the network outages. Fault tolerance, dual homing, redundant power supplies and the like have all led to improved availability. Fast forward to today, most networks enjoy five nines (99.999%) of uptime. Because the downtime problem has largely been overcome, the industry is finally coming around to addressing the old slowness problem. That’s why latency is the new outage.
What causes latency?
Cabling and connectors: This is the summation of physical mediums used between the source and the destination. Generally this is a mix of twisted-pair cabling and fiber optics. The type of medium can impact latency, with fiber being the best for reducing latency. A poor connection can introduce latency or worse, packet loss.
Distance: The greater the physical distance, the greater the possibility of introducing latency.
Routers and switches: The internet is largely a mesh configuration of network devices that provide connectivity to everywhere we want to connect. Each switch and router we pass through introduces a bit of latency that adds up quickly. Router hops introduce the most.
Packet loss: If the transmission ends up traveling over a poor connection or through a congested router, this could introduce packet loss. Packet loss in TCP connections results in retransmissions which can introduce significant latency.
How latency is measured
Network latency is the time required to traverse from the source to the destination. It is generally measured in milliseconds. Here we will explore how latency can be measured and the factors that can introduce latency. This in turn will help us understand how optimizations can be made that will minimize the problems introduced by it.
Below is the beginning of a TCP handshake. After the DNS lookup and the ARP, the host reaches out to the IP address of the destination using a SYN in order to open a connection. The destination then responds with an ACK. The timestamps between these two packets can be used to measure the latency. The problem is that the measurement needs to be taken as close to source hosts as possible. This would be point A.

The best place for point A (shown above) is on the host itself. However, this is not always possible. To get an idea of what I’m talking about, most of us have executed ping on the command line in order to see if a host is responding. Although the ping utility on our computers uses ICMP, which is the first to see latency, other utilities similar to ping can execute tests similar to ping on top of TCP and UDP.
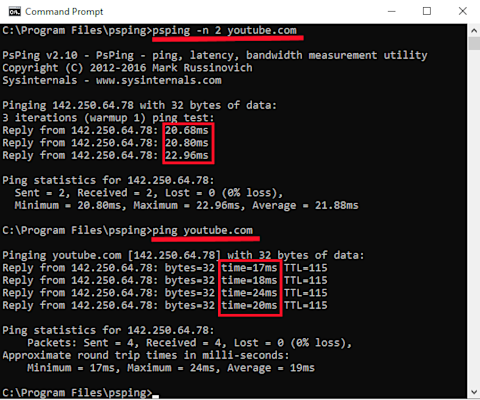
Below is a comparison between a TCP ping using psping and an ICMP ping.

Notice in the image above how the differences in responses between psping and ping are not terribly significant. However, if any of the connections or devices in the path to youtube.com were congested, the ICMP ping would likely show higher millisecond (ms) rates compared to the psping measurements.
If you are curious about how a UDP ping would compare, psping can be used to perform this latency test as well. Read the documentation for further details. When I ran the test, the results came back with pretty much the same response times as ICMP and TCP. If you google udp ping utility you’ll find several executables that are fun to test with.
Some vendors might tell you that latency doesn’t apply to UDP because it is connectionless (i.e., one way). Tell this to the user trying to conference with someone who’s video is all choppy. Or, try telling this to the folks at Google who developed Quic over UDP. Speaking of which…
I was looking for a command line ping utility that used the Quic UDP protocol against websites. Although I wasn’t able to find one, I did come across a web page called http3check.net that allows you to enter a domain and test the Quic connection speed. Below I ran it for youtube.com from my home office:
Connection ID	  PKT RX	  Hand Shake
-------------	  ------	  ----------
CB8FB44ABF...	  4.185ms	  12.457ms
43237B1614...	  9.604ms	  10.629ms
These ping utilities are fine for point troubleshooting, but for ongoing tests against mission critical networks and websites, synthetic monitoring is the best option to proactively monitor network performance.
NOTE: Some tools (e.g., ping, iperf and netperf) measuring with the same protocol for latency to the same destination will provide different results. If you are serious about testing, it is best to try multiple.
How to reduce latency
Reducing latency over the network first requires an understanding of where the points of slowness exist — and there could be multiple sources. On the command line, TCP Traceroute is my favorite turn-to utility for mapping out the hop-by-hop connection between my device and the destination.
What is traceroute and how does it work?
Traceroute returns the router for each hop in the path to the destination as well as the corresponding latency. If one of the on-prem routers is introducing the latency, I can verify that there is ample bandwidth on each connection between routers. If this looks good, I could look at upgrading routers. If the latency is the destination server, I might be out of luck. However, if the latency is being introduced by my service provider, I can look to switch ISPs. If the latency is beyond my ISP, the problem could become more difficult to resolve. I might be able to find a local content delivery network (CDN) that has the resource I need a connection to. In this case, I might be able to persuade my ISP to peer with another service provider or participate in an internet-exchange point (IX) to get a faster connection to the resource.
What is synthetic monitoring?
The utilities discussed above are fine for one-off troubleshoots; however, companies need to be more proactive and run these tests continuously. This is because they need historical information on connections that allow them to be decisive when it comes time to switch service providers or add additional transit.
For many companies with large-scale infrastructure, synthetic monitoring is incorporated as part of the network observability strategy. These tools execute many of the same tests I shared earlier to similar types of destinations with several big differences.
With synthetic monitoring:
- Tests are run against the same destinations from multiple, even dozens of different locations.
- The data is often enriched with other information, such as flows, BGP routes and autonomous systems (AS). This allows NetOps teams to identify the specific IP addresses the tests need to be run against, as well as the locations where the tests need to be executed from. Context like this helps ensure the results from the tests best represent the user base.

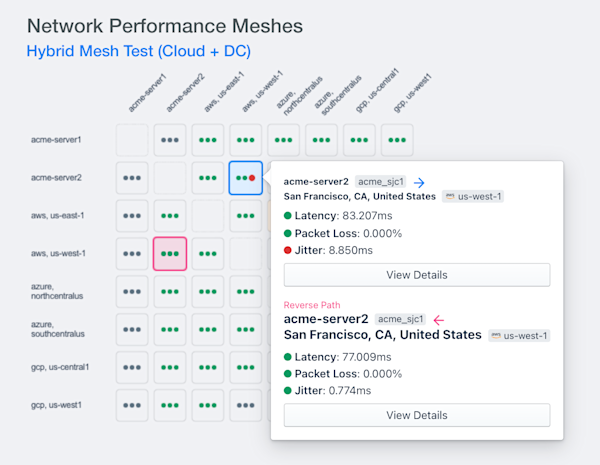
Above we can see a full mesh of synthetic monitoring agents that are performing sub-minute tests against one another. The proximity of the testing agents to the end users targeting the tested resources was intelligently determined by collecting additional telemetry data. Latency, packet loss and jitter metrics are all collected for historical trending and alerting.
Stop putting up with latency as the new outage
To learn about synthetic monitoring, start a free, 30-day trial and see how the Kentik Network Observability Cloud can help you stop accepting that latency is the new outage.


