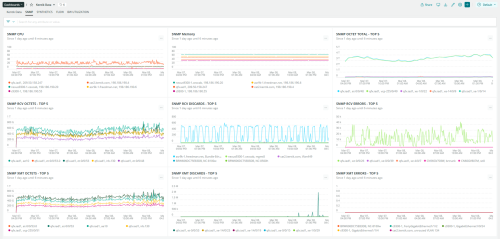
There's so much more we can do with our partners when we work together seamlessly. And to show the power and the depth of these partnerships, we're excited to share with you a big announcement. We've teamed up with Kentik to deliver network performance telemetry in New Relic One. Now, for those of you who might not be familiar with Kentik, they're a network observability company, and like New Relic One, Kentik provides a fully SaaS platform. But before we get into the details, I'd like to highlight the power of this partnership in terms I'm certain will resonate with the engineers in the audience. When software fails, it happens in unexpected ways and at the worst time. And when there's an unexpected problem in the middle of the night, software engineers often suspect a network failure. But usually, they don't have the tools or the context to diagnose the problem, and so they wake up the on call network engineer even if they're unsure that there's a network issue at all. Now, as you can imagine, this leads to a lot of frustration, a lot of finger pointing, and ultimately slower resolution of issues. DevOps teams and NetOps teams both know that there must be a better way. And since modern architectures have eliminated many of the technical boundaries, the times come to help eliminate the boundaries between the teams. With this network context in New Relic One, teams will have even better information to help rule out or rule in the network as the cause of an issue. They can more often let their NetOps team sleep at night when the network is in the blame and provide better context to them when network configuration or availability zone outage is implicated in an alert. And Teams achieve this with a simple setup, letting New Relic One do the hard work of identifying and connecting all of their network entities to their apps and to their infrastructure. Teams then get alerts and AI capabilities like anomaly detection in New Relic Lookout right out of the box. The data can then be viewed and analyzed in dashboards or in custom visualizations. Now I'd like to introduce you to the co founder and CEO of Kentik, Avi Friedman, to tell you a little bit more about this great partnership. Welcome, Avi. Thanks, Buddy. I'm super excited to be here with you today. As you mentioned, Kentik is the network observability company. With Kentik, network engineers can ask any question about their network performance and security and get answers fast. With our New Relic One partnership, customers can use our integration to add network context into New Relic One from network sources like VPC flow, SNMP, NetFlow and performance testing. And our One also converts this telemetry into first class network entities like router, switch, VPC, or geography, and correlates it cross stack. For us, this partnership helps us grow by connecting with all the engineers that use the NR1 platform and by letting all of our network customers connect to their peers in other groups. I'd love to show you what it looks like, but before I get to a demo, I'd like to tell you about how we started this partnership. The funny thing is, it all started with a free account. Last year, we saw New Relic's open platform announcement featuring the telemetry data platform and signed up for an account to test it out. As a back end nerd, I decided to use the CSDK. It was simple, easy and reliable. I had data going in fifteen minutes. You could see some of the code on this slide. Surprisingly to me at the time, it just worked. We'd been trying all sorts of observability platforms for years and quickly broke them with network data, either with volume or almost always with cardinality. So to me, it was amazing that the NR1 UI not only showed the data super quickly, but also let me pull the attributes and the cardinal values for those attributes super quick, even over weeks of network data. Most vendors prefer one type of telemetry as primary, and R1 supports many kinds of data while adding context and enrichment, which was all a big plus for us. Of New Relic's, metrics, logs, events, and traces, we chose metrics and events to represent network data, which I'll show you in the demo. But before the demo, a couple other things I wanted to share with you about partnering with New Relic. First, as I was getting to know New Relic One, I submitted a couple dozen pieces of web feedback about UX, UI, ingest, and documentation. I was really floored with the quick responses I got, many of which led to some great conversations with amazing people. I was especially floored because I was just using a free account at the time. That experience drove great conversation at Kentik, and I think it's a great model of customer centricity for us all. Second, also last summer, we saw New Relic's open source announcement. We've been a big believer in the importance of bringing network telemetry into the open telemetry world. Really appreciated New Relic's announcement and commitment and are looking forward to partnering with New Relic on that. So with that, let's go to the demo. I'm gonna start here with New Relic's Explorer. On the left, we can see the network entities identified alongside the other first class citizens like application and infrastructure components. Here, we're looking at cloud VPC networks with the most important metrics like endpoints, conversations and traffic highlighted. I could click on a VPC to get a pre built dashboard or if I go to navigator, we'll see that it's auto grouped the VPCs by tag, colored them by status, and no config was needed. This all works out of the box. And if I want to see more, I can click on a VPC and a sidebar will pull up with all the key metrics. And if I wanted to, I could click to see the auto generated dashboard. Moving to Lookout, this is a visual view of anomalies powered by New Relics AI. It's analyzing the network metrics and shows anomalies at a quick glance. Again, I can click for more details and it'll show me more detail metrics, and give me access to dashboard for more detail and dig in as well. And finally, we can bring it all together the traditional way as well. With this dashboard, which adds in an open source network visualization, you can see network behavior alongside app, compute, and business metrics, all in dashboards the teams already use. So thanks for taking this quick tour with me, but this was really all just a taste. The New Relic and Kentik teams are hard at work designing and building a full UX for you, but we need your feedback. We're inviting all customers to sign up for early access right now. Please go to kentik dot com slash featurestack or newrelic dot com slash network observability to save your spot in the early access program. Thanks so much to all our New Relic friends and back to you, Seema. Wow, it's so exciting to see the power of our open platform. We're looking forward to more innovation from this partnership with Kentik and other ecosystem partners.


