Synthetic network monitoring
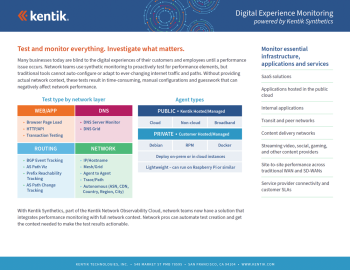
Many businesses today are blind to the digital experiences of their customers and employees until a performance issue occurs. Network teams use synthetic monitoring to proactively test for performance elements, but traditional tools cannot auto-configure or adapt to ever-changing internet traffic and paths. Without providing actual network context, these tests result in time-consuming, manual configurations and guesswork that can negatively affect network performance.
With Kentik Synthetics, part of the Kentik Network Observability Platform, network teams now have a solution that integrates performance monitoring with full network context. Network pros can automate test creation and get the context needed to make the test results actionable.
Test to/from anywhere
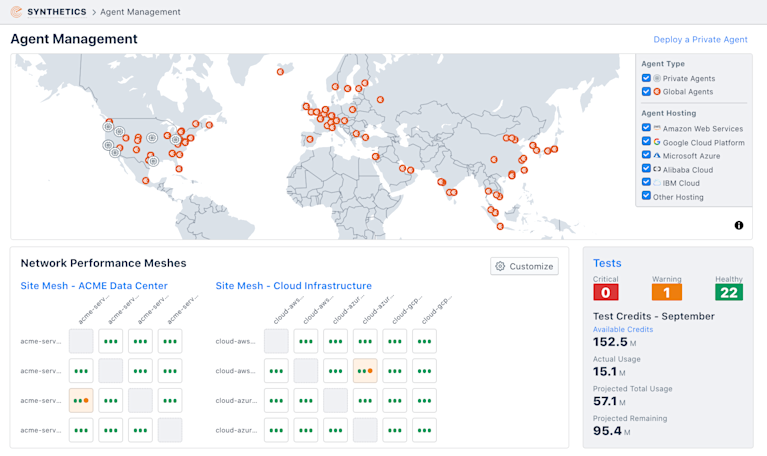
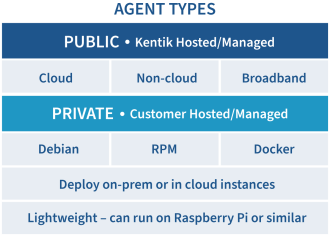
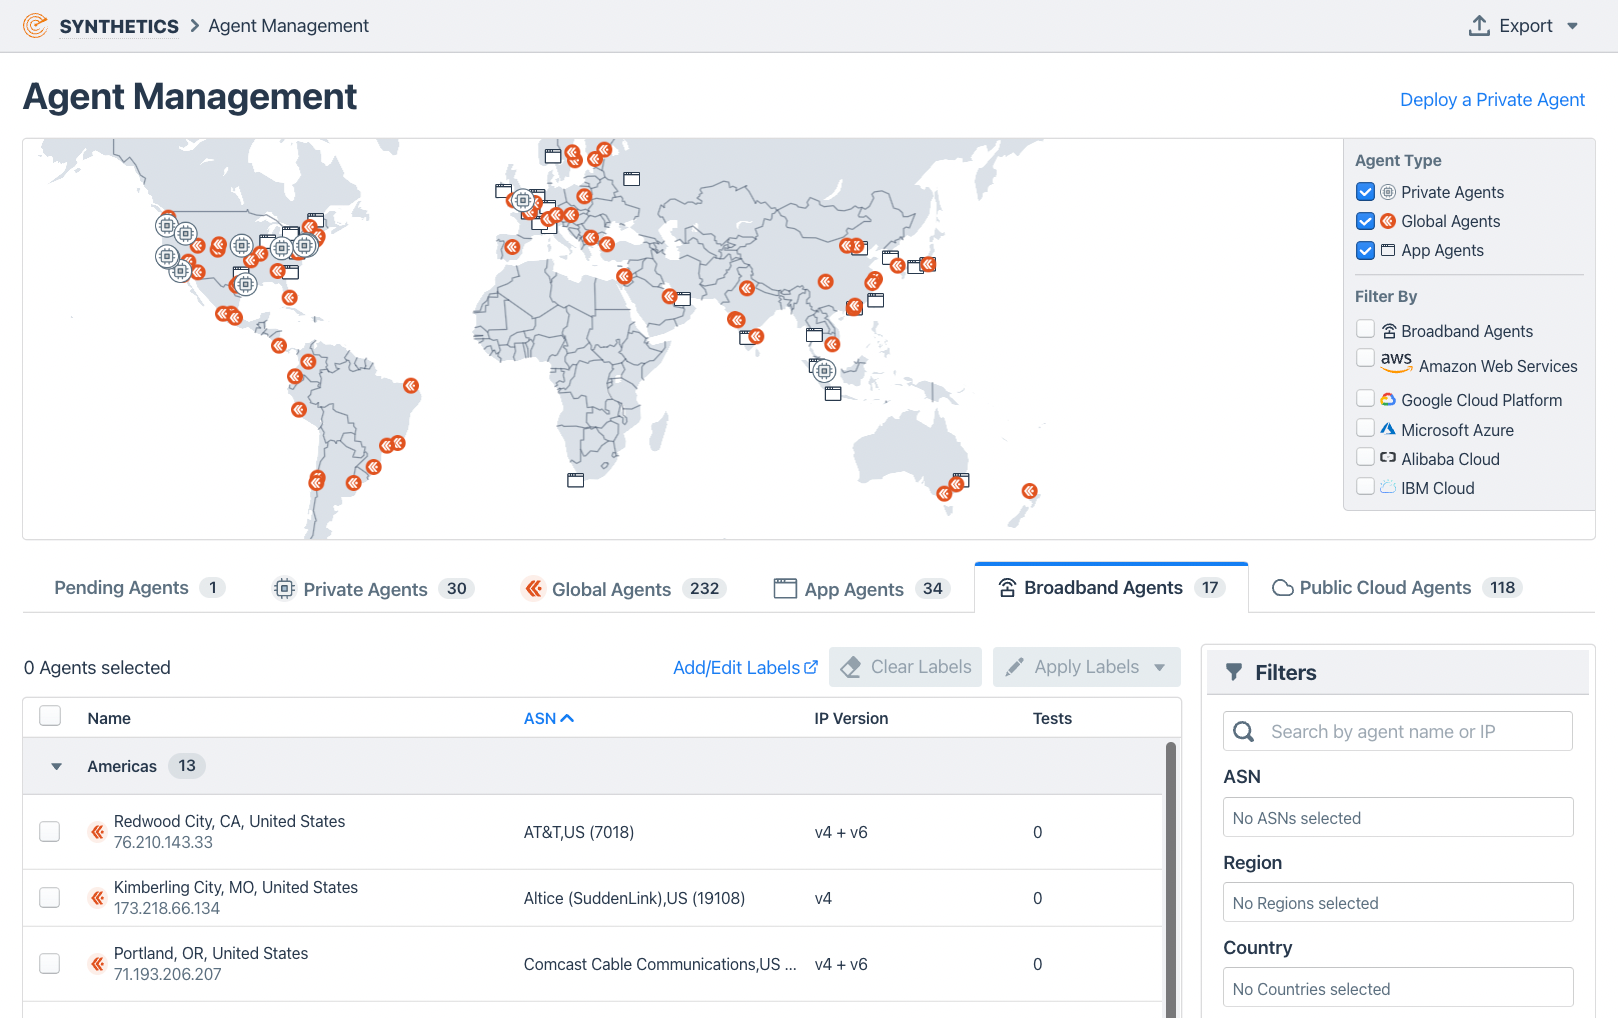
Emulate the performance of applications for your global users. Test from any region in public cloud providers. Use our public agents and augment with private agents in your own network. Test web applications using app agents. Manage agents, tests and data with an API.
The Kentik Global Synthetic Network includes 200+ strategically positioned global agents in internet cities around the world and in every cloud region within AWS, Google Cloud, Microsoft Azure and IBM Cloud.
Autonomous tests
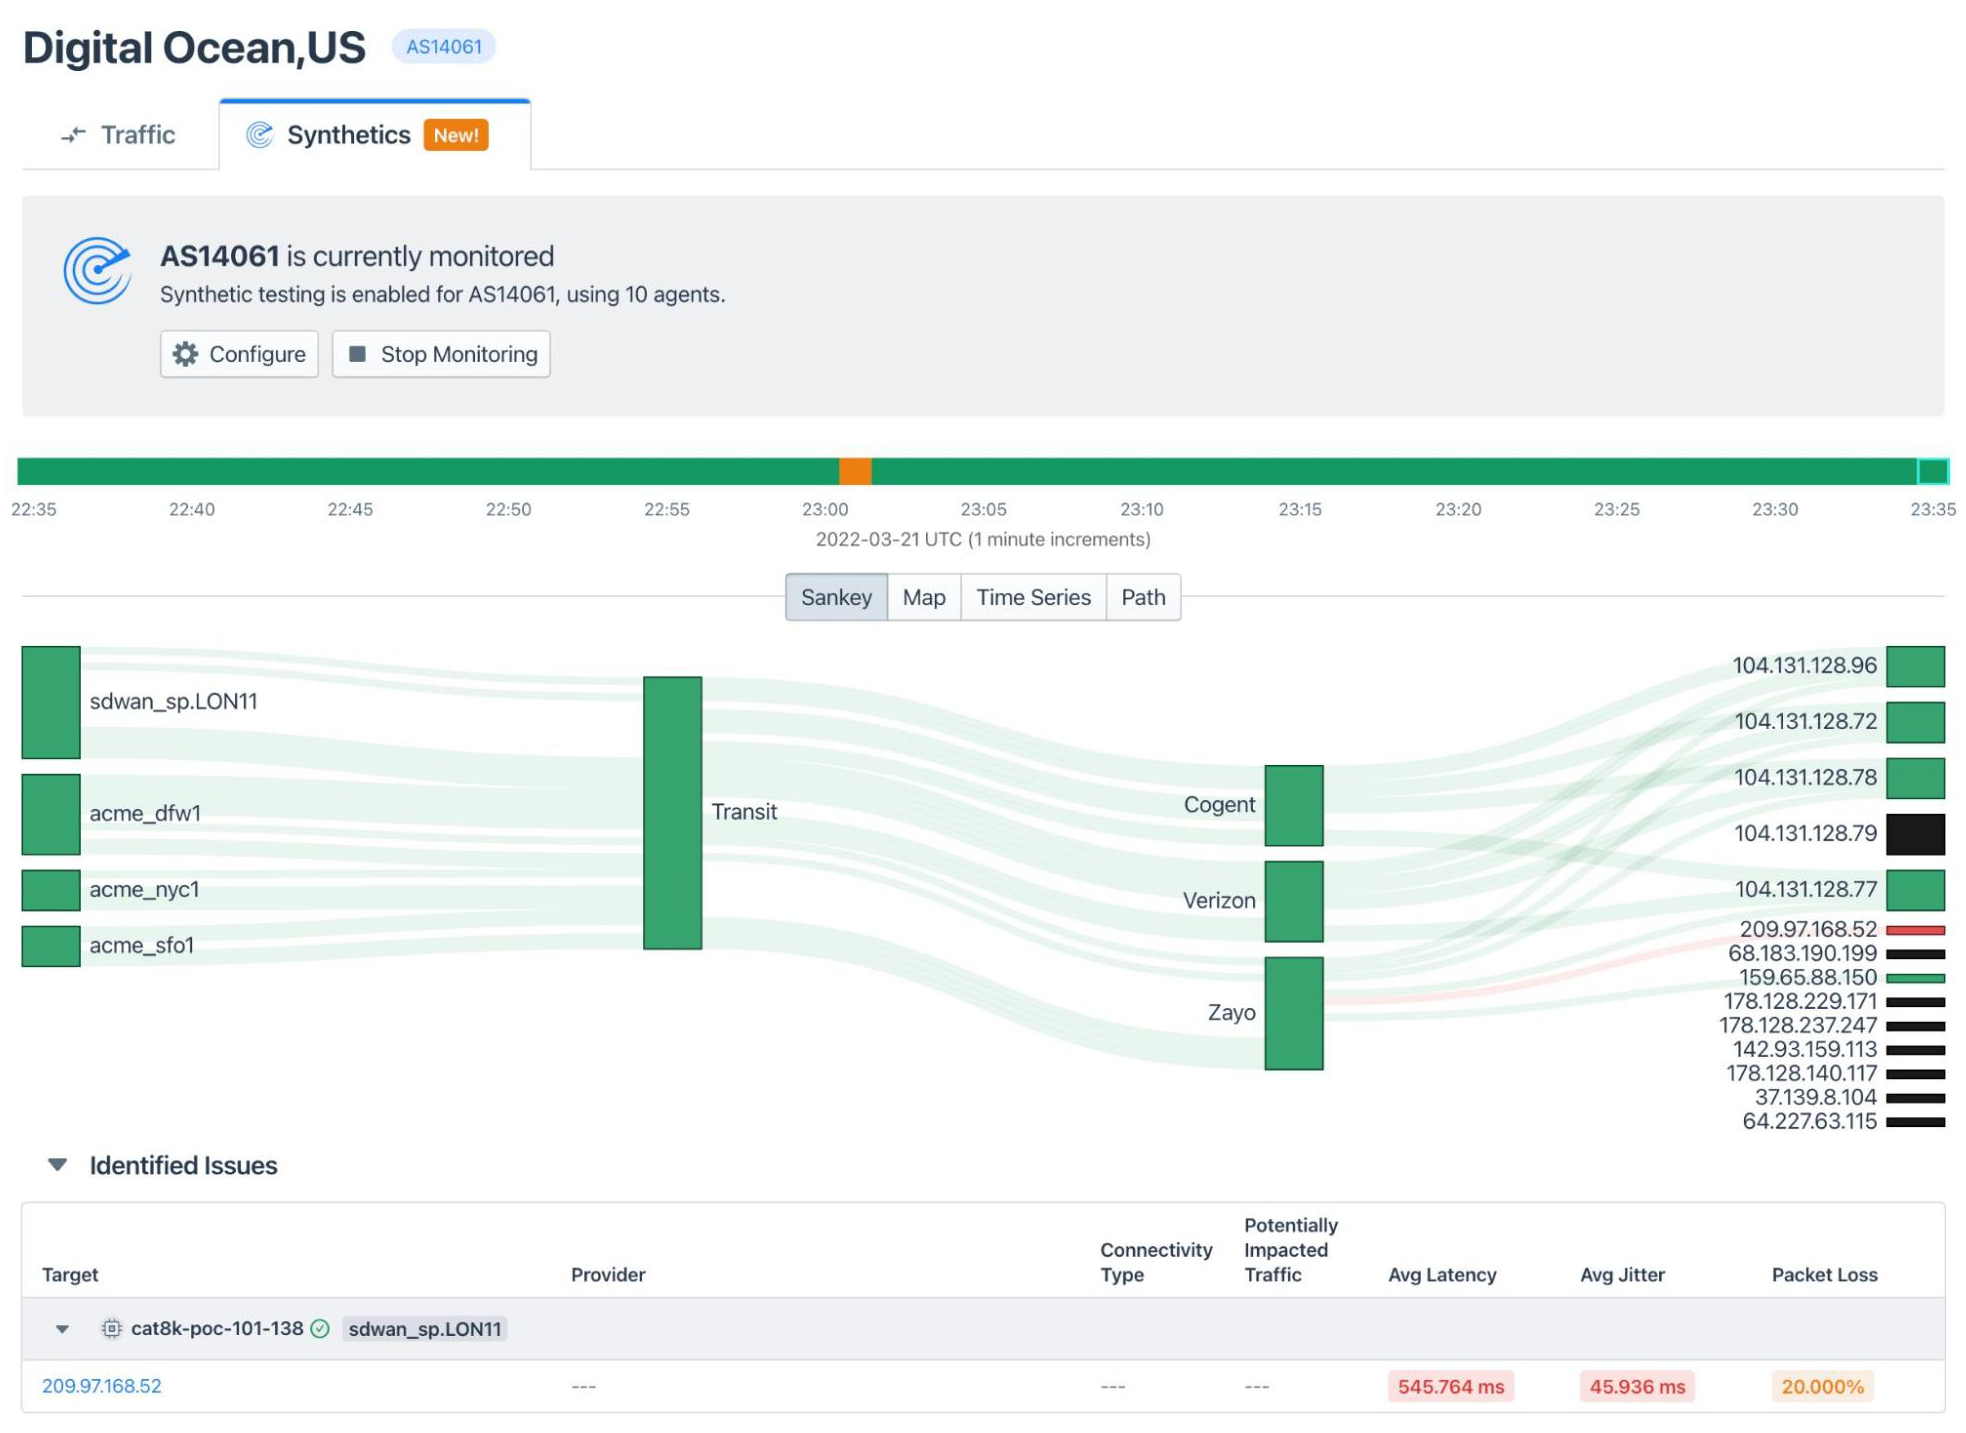
Autonomous tests allow testing towards a higher-level entity (ASN, CDN, country, region or city) without having to specify individual IP addresses. IP addresses are determined automatically, based on actual network traffic, and are kept up to date via periodic refreshes.
The State of the Internet at a glance
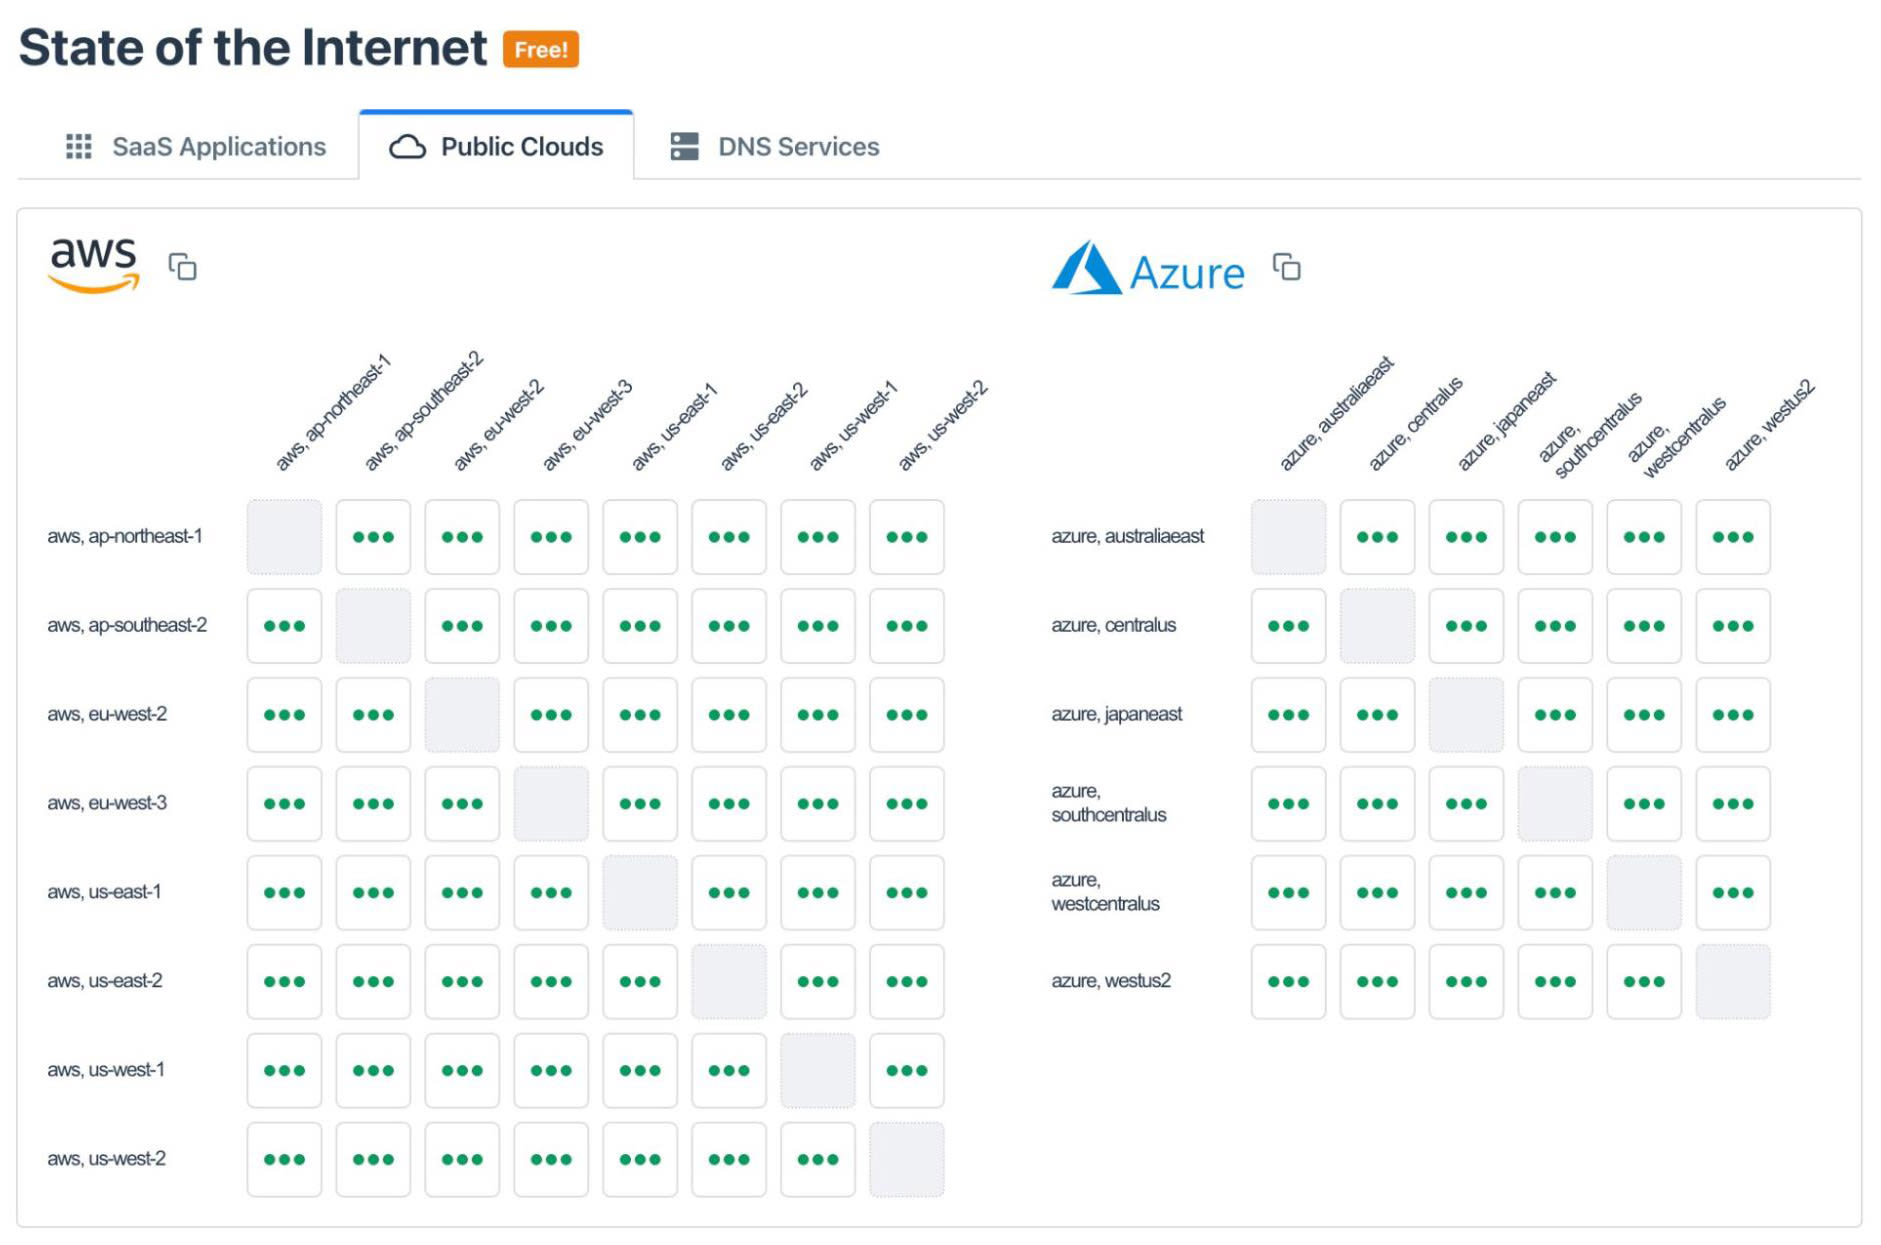
Monitor the state of SaaS applications, in and between public clouds and DNS service providers. Access hundreds of our agents across the globe or easily deploy your own so that you can monitor what’s important to you. Quickly identify whether your infrastructure, the cloud, or an application is the root cause of an issue. At no additional cost, you can see all of our results on the state of the internet.
Mesh tests
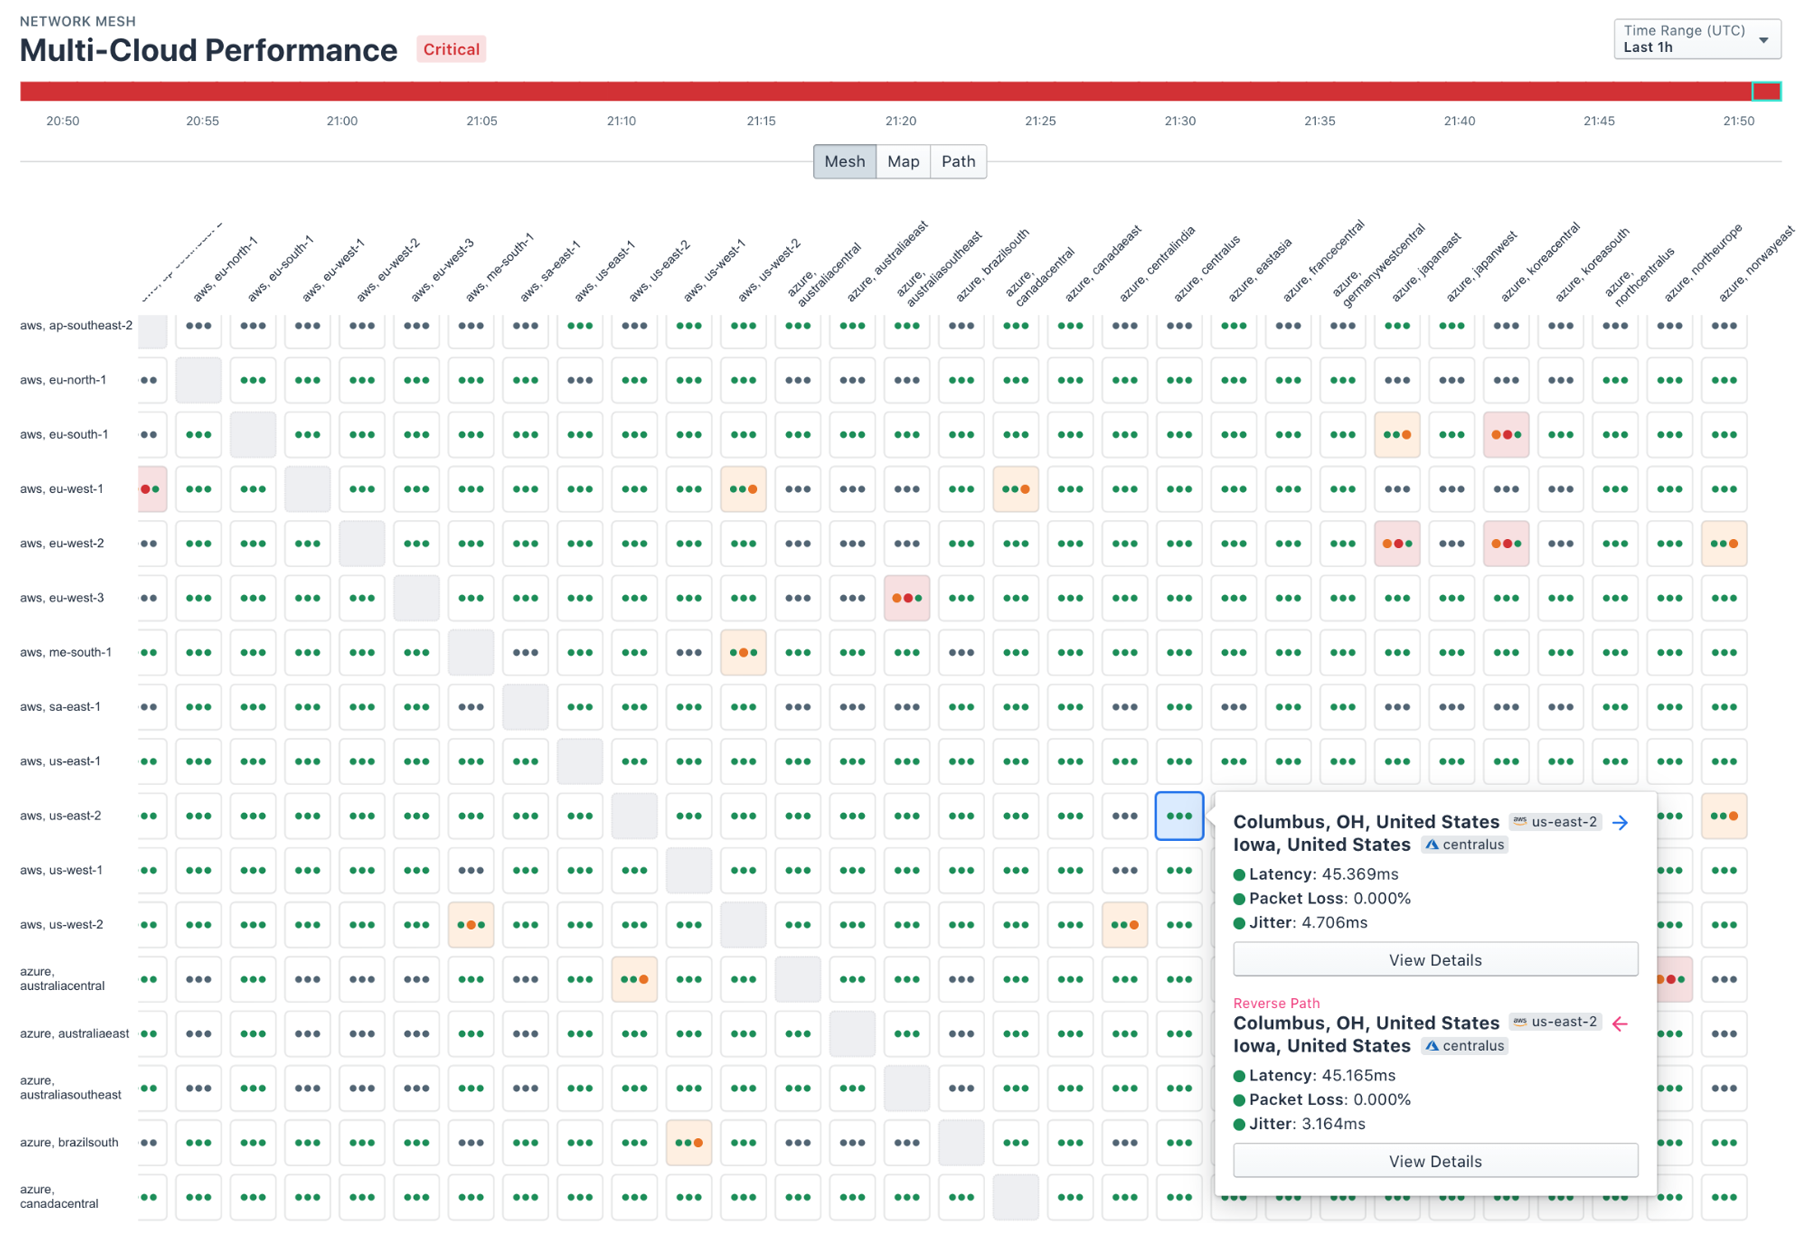
Kentik Synthetics curates test results for quick and easy assessment. Complex, multi-site mesh tests can be set up with just a couple of clicks and the matrix style view helps identify problems at a glance so you can quickly drill down to the root of the issue. Test between any combination of PoPs, data centers, public and private clouds, and/or private network sites.
The Path View
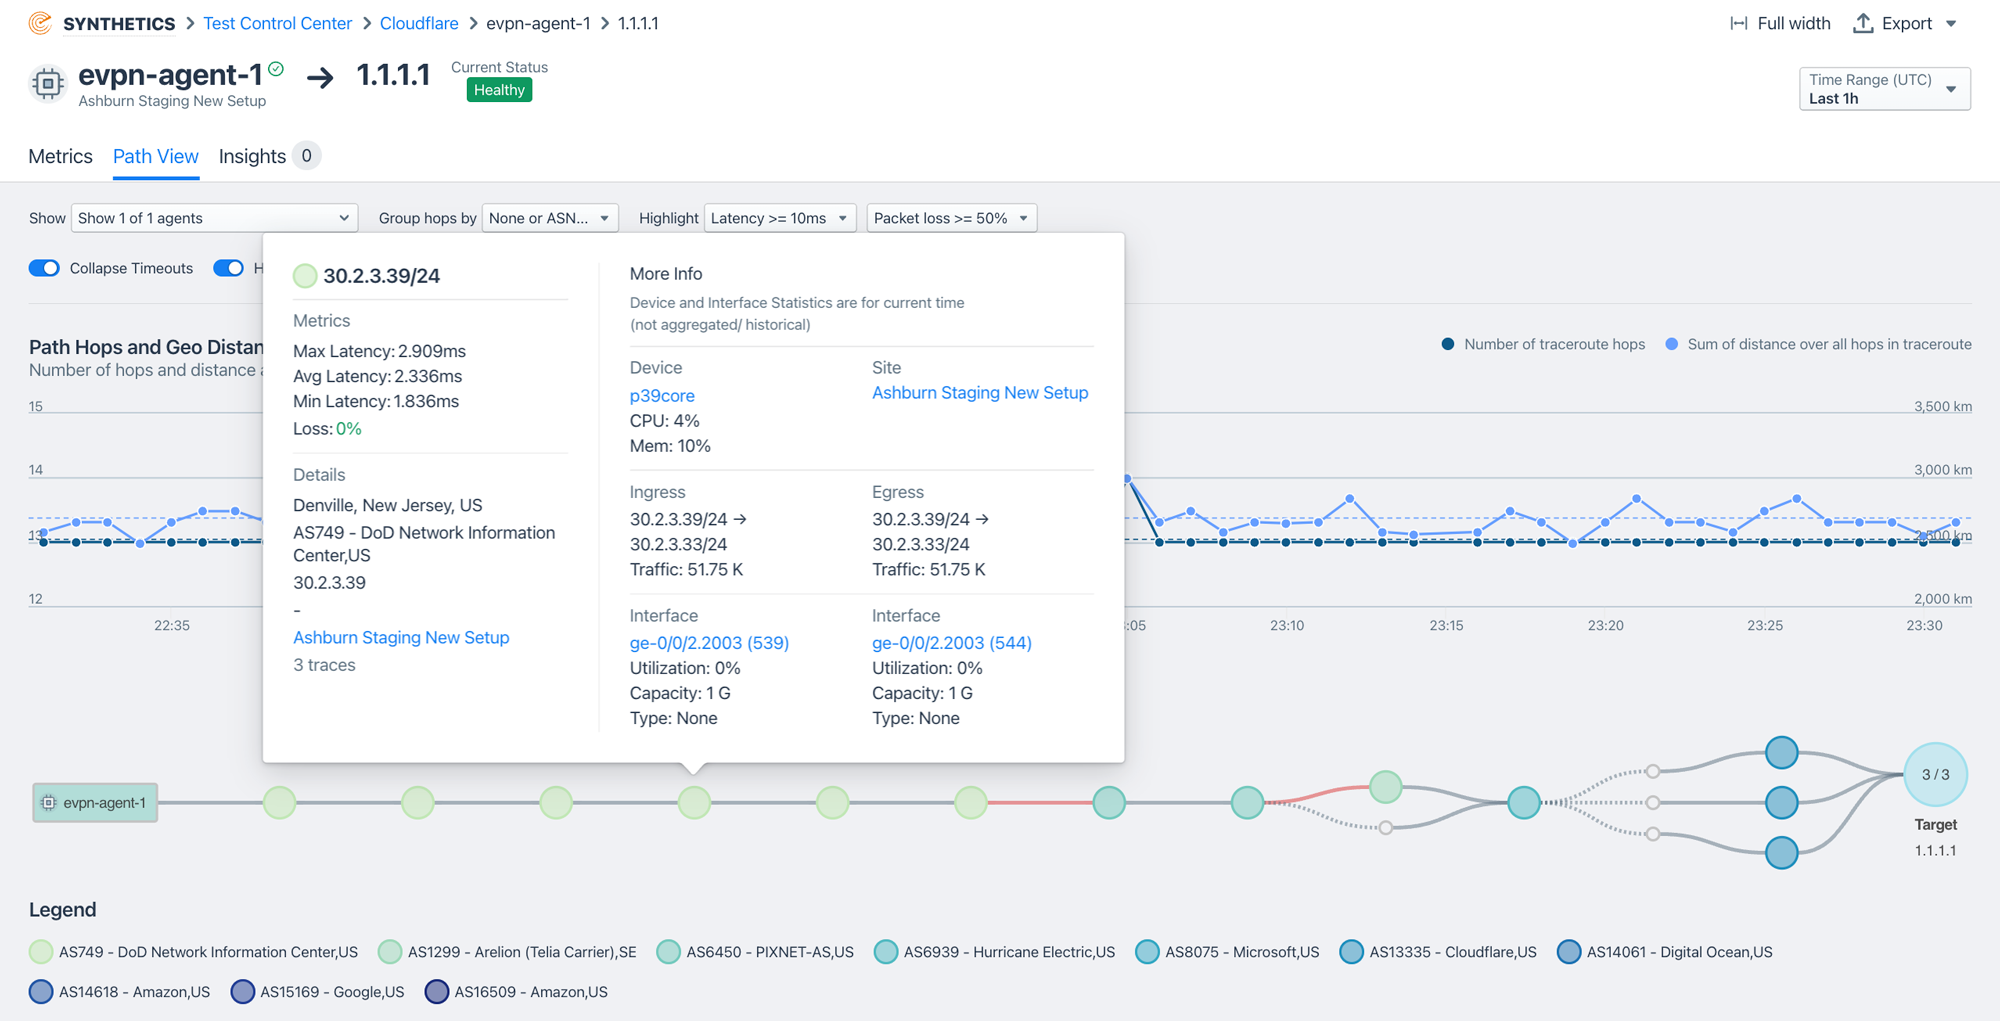
The Path View allows you to get to the root of a network issue quickly. It shows the multiple paths taken by your traffic and identifies ASNs traversed along the way, highlighting nodes and links with high latency and loss as well as changes to AS paths over time.
BGP monitoring
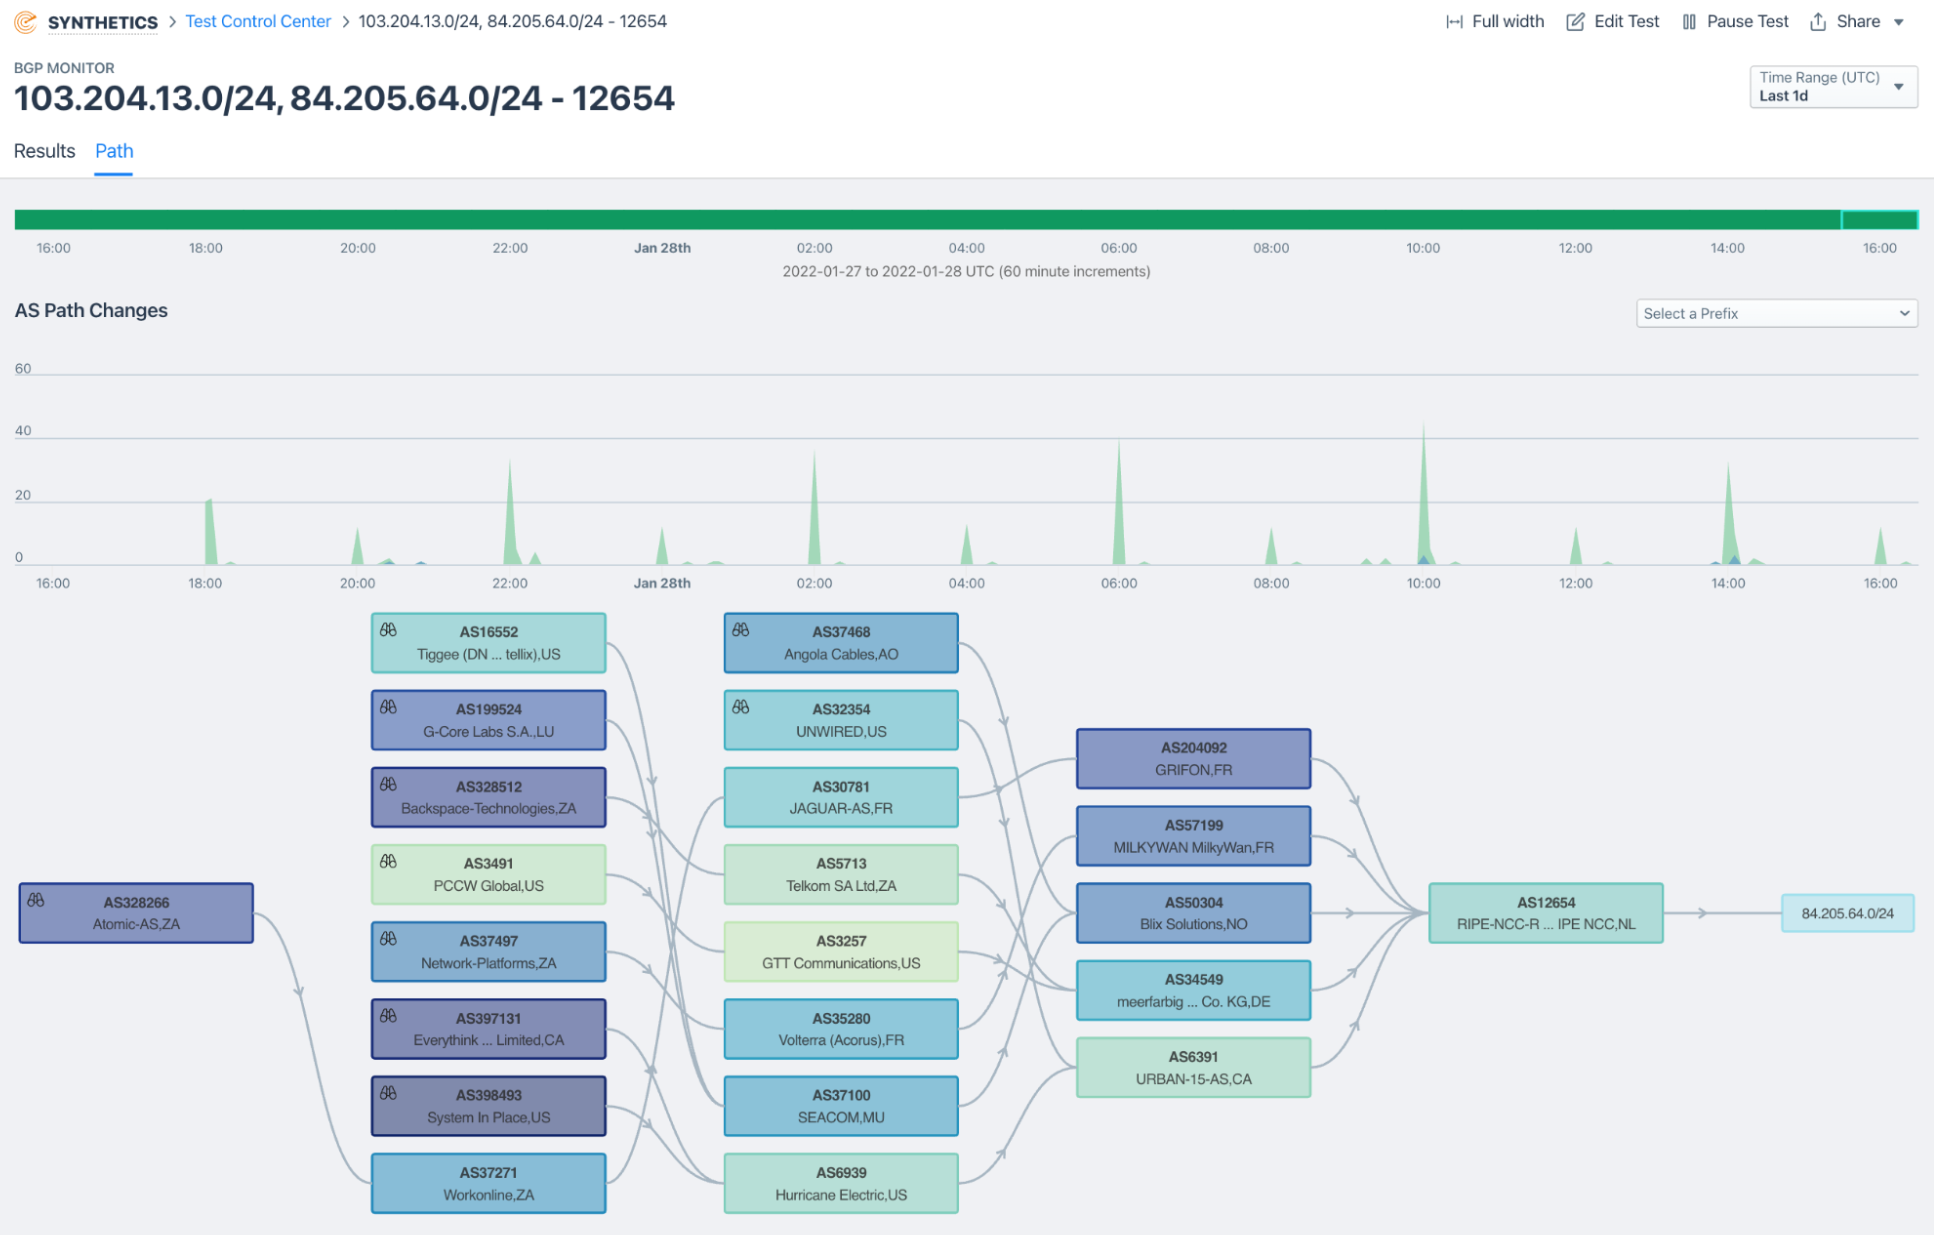
Kentik collects and monitors all BGP data relevant to your network. See your BGP announcements and withdrawal events, paths taken, and get alerted to hijacks, reachability issues and path changes. Receive notifications of unexpected origins and invalid RPKI status via your chosen channel (Slack, email, PagerDuty, and more).
Pricing
Kentik Synthetics enables network teams to test everything that matters — frequently and autonomously — with simple pricing that offers more testing at a lower cost. The management console automatically calculates the number of credits needed per test and warns you ahead of time if you may be running out of credits. Kentik Pro customers receive 2.5M credits per month. Kentik Premier customers receive 5M credits per month. Additional credits are available through the purchase of a SyntheticPak.
What is synthetic monitoring?
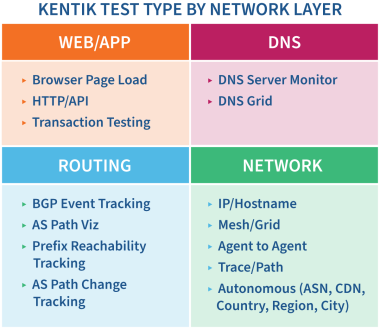
In the networking context, synthetic monitoring means imitating different network conditions and/or simulating differing user conditions and behaviors. Synthetic monitoring achieves this by generating different types of traffic (e.g., network, DNS, HTTP, web, etc.), sending it to a specific target (e.g., IP address, server, host, web page, etc.), measuring metrics associated with each test and then building key performance indicators using those metrics.
These synthetic tests are both automatic and periodic. They are conducted at regular intervals to ensure that application, website, network component or service (such as an API endpoint) is still performing as expected. With Kentik Synthetic Monitoring, you can configure testing intervals even as low as less than one minute.
In contrast to flow or packet capture (which could be called passive forms of monitoring), synthetic monitoring is a way to proactively track the performance and health of networks, applications and services.
Kentik can be the cornerstone of your digital experience monitoring strategy by combining both forms of monitoring to bring a new level of observability to your mission-critical networks, services, and applications. For an introduction to these topics, see our Kentipedia articles “What is Synthetic Monitoring?” and “What is Digital Experience Monitoring?”.
Monitor essential infrastructure, applications and services
- SaaS solutions
- Applications hosted in the public cloud
- Internal applications
- Transit and peer networks
- Content delivery networks
- Streaming video, social, gaming, and other content providers
- Site-to-site performance across traditional WAN and SD-WANs
- Service provider connectivity and customer SLAs
Key capabilities
- Autonomous testing
- Instant site-mesh test setup
- Network and application layer testing
- Correlation of synthetic performance metrics with real traffic
- 200+ global agents covering all major cloud providers and regions
- Private agents for x86 and ARM
- Configurable test frequency down to sub-minute
- Intelligent alerting and diagnostics
Key innovations
- Richest BGP data set with real time updates and alerting
- Easy mesh setup for large scale PoP-to-PoP performance monitoring
- Correlation of synthetic performance metrics with real traffic
- Autonomous, scenario-based testing
- Kubernetes monitoring
- Deep (traceroute driven) path visualization (infused with SNMP and traffic data)
- Alerts plus investigation integrated with traffic and full network context
- Simple and affordable pricing
Platform
Solutions
- Reduce Cloud Spend
- Migrate To and From Any Cloud
- Improve Cloud Performance
- Optimize Enterprise WAN
- Network Performance Monitoring
- Deliver Exceptional Digital Experiences
- Detect and Mitigate DDoS
- Harden Network Policy Management
- Investigate Security Incidents
- Visualize All Cloud and Network Traffic
- Troubleshoot Any Network
- Understand Internet Performance
- Optimize Data Center Networks
- Consolidate Legacy Tools
- Optimize Peering and Transit
- Plan Network Capacity
- Reduce Network Spend
- Grow Subscriber Revenue
