
Summary
At Kentik, we built Kentik Detect, our production SaaS platform, on a microservices architecture. We also use Kentik for monitoring our own infrastructure. Drawing on a variety of real-life incidents as examples, this post looks at how the alerts we get — and the details that we’re able to see when we drill down deep into the data — enable us to rapidly troubleshoot and resolve network-related issues.
Troubleshooting Our SaaS… With Our Own Platform
Effective Site Reliability practices include monitoring and alerting to improve incident response. Here at Kentik, we use a microservices architecture for our production Software as a Service (SaaS) platform, and we also happen to have a great solution for monitoring and alerting about the performance of that kind of application. In this post, we’ll take four real incidents that occurred in our environment, and we’ll look at how we use Kentik — “drinking our own champagne” — to monitor our stack and respond to operational issues.
Issue 1: Pushing Code to Repository
Our first incident manifested as an inability to push code to a repository. The build system reported: Unexpected status code [429] : Quota Exceeded, and our initial troubleshooting revealed that it couldn’t connect to the Google GCE-hosted container registry, gcr.io. But the GCE admin console showed no indication of quota being exceeded, errors, expired certification, or any other cause. To dig deeper, we looked at what Kentik could tell us about our traffic to/from gcr.io. In Data Explorer, we built a query, using the time range of the incident, with “Full Device” as the group-by dimension, and we filtered the query down to the IP address for gcr.io.
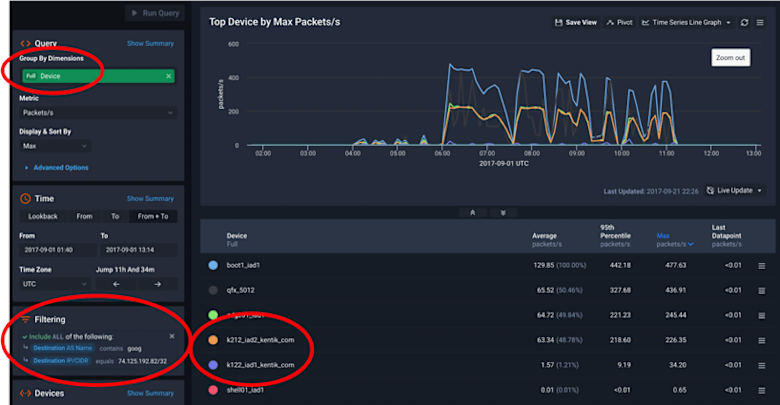
As we can see in the output, two hosts (k122/k212) were sending a relatively high rate of pps to gcr.io but then stopped shortly after 11:00 UTC. It turns out that k122/k212 are development VMs that were assigned to our summer interns. Once we talked to the interns we realized that a registry project they were working on had scripts that were constantly hitting gcr.io. The astute reader has probably already realized that a HTTP response code of 429 means we were being rate limited by gcr.io because of these scripts. Without the details that we were able to query for in Kentik this type of root-cause analysis would have been difficult to impossible.
Issue 2: Load Spike
The next incident was brought to our attention by an alert we had set up in Kentik to pro-actively notify us of traffic anomalies. In this case, the anomaly was high bps/pps to an ingest node (fl13) that deviated from the historical baseline and correlated with high CPU on the same node.

We turned again to Data Explorer to see what Kentik Detect could tell us about this increase in traffic, building a query using “Source AS Number” for the group-by dimension and applying a filter for the IP of the node that was alerting.
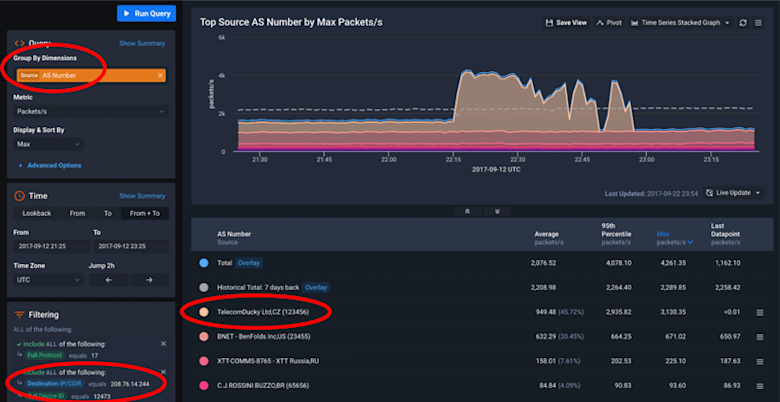
As you can see from the resulting graph, there was a big spike in traffic around 22:15 UTC. Looking at the table, we can see that traffic was coming from an ASN that we’ve anonymized to 123456. Having a good pro-active alert was hugely helpful, because it allowed us to quickly understand where the additional traffic was coming from and which service it was destined to, to verify that this node was handling the additional load adequately, and to know where to look to verify other vitals. Without this alert, we may have never been able to isolate the cause of the increase in CPU utilization. Using Kentik Detect we were able to do so in under 10 minutes.
Issue 3: Query Performance
Like most SaaS companies we closely monitor our query response times to make sure our platform is responding quickly to user requests, 95 percent of which are returned in under 2 seconds. Our next incident was discovered via an alert that triggered because our query response time increased to more than 4 seconds. We simultaneously had a network bandwidth alert showing more than 20 Gbps of traffic among 20 nodes. Drilling down in Data Explorer, we were immediately able to identify the affected microservice. We graphed the traffic by the source IP (sub-query processes) hitting our aggregation service, which revealed a big spike in traffic. Our aggregation service did not anticipate 50+ workers responding simultaneously during a large query over many devices (flow sources).
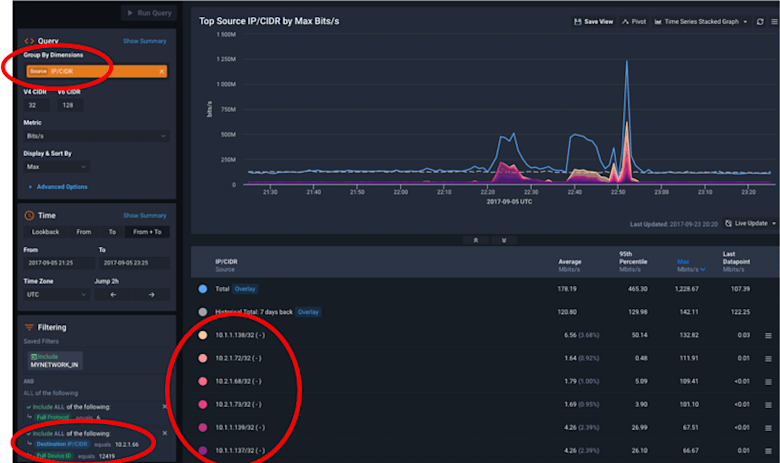
We also looked at this traffic by destination port and saw that in addition to the spikes on port 14999 (aggregation service) we saw a dip on 20012 (ingest) which is a service running on the same node. The dip indicates that data collection was also affected, not just query latency.
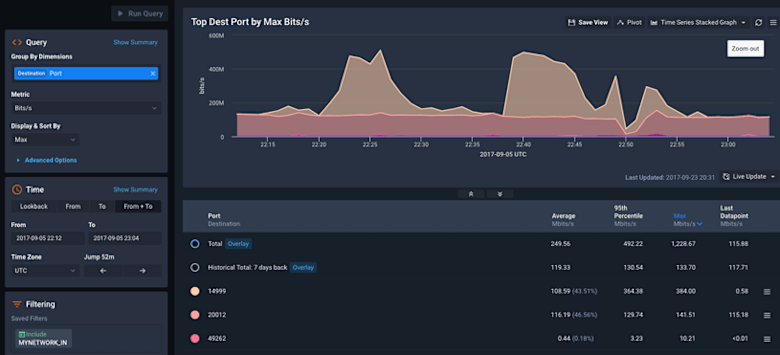
Because Kentik Detect gave us detailed visibility into the traffic between our microservices we were able to troubleshoot an issue in under 30 minutes that would otherwise have taken us hours to figure out. And based on the insight we gained, we were able to tune our aggregation service pipeline control to prevent a recurrence.
Issue 4: High Source IP Count to Internal IP
The final incident we’ll look at isn’t technically a microservices issue, but it’s something that most network operators who deal with campus networks will be able to relate to. Once again, we became aware of the issue via alerts from our anomaly detection engine, with three alarms firing at the same time:
- High number of source IPs talking to our NAT
- High number of source IPs talking to a proxy server
- High number of source IPs talking to an internal IP

Our initial investigation revealed that the destination IP was previously unused on our network. Given all the news recently of data breaches, that led us to wonder if a compromise had taken place.

On our Active Alerts page we used the Open in Dashboard button (outlined in red in the screenshot above) to link to the dashboard associated with the alert, where we were able to quickly see a profile of the traffic.

The emerging traffic profile looked very much like a normal workstation — except that it appeared to be involved in some kind of digital currency mining, and it was traversing the same Internet transit as our production network!
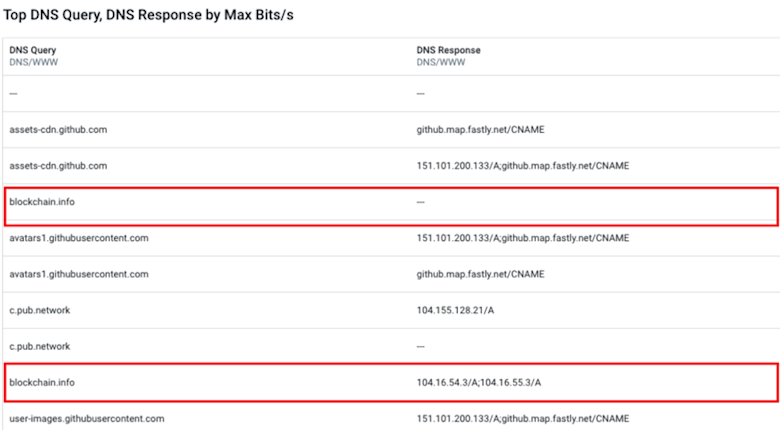
Using a Data Explorer query to reveal the DNS queries made by this host, we were able to confirm this suspicion.

After disabling the port, we investigated and discovered that one of our remote contractors had connected to the WiFi in our datacenter. We have since locked down the network. (We still love this contractor, we just don’t want him using our network to mine virtual currencies.) Without the alerts from Kentik Detect, and the ability to drill down into the details, it would likely have taken much longer for us to learn about and resolve this rogue host incident.
Summary
The incidents described above provide a high-level taste of how you can use Kentik Detect to monitor network and application performance in the brave new world of distributed compute, microservices, hybrid-cloud, and DevOps. If you’re an experienced Site Reliability/DevOps engineer and you’re intrigued by this post you might be just the kind of person we need on our SR team; check out our careers page. If you’re an existing customer and would like help setting up to monitor for these type of incidents, contact our customer success team. And if you’re not already a Kentik customer and would like to see how we can help you monitor in your environment, request a demo or start a free trial.
