What are VPC Flow Logs?
VPC Flow Logs are a feature provided by cloud providers like Amazon Web Services (AWS) that allows users to capture information about the IP traffic going to and from network interfaces within their Virtual Private Cloud (VPC). VPC Flow Logs are used to gain insight into network traffic patterns, monitor network performance, and enhance security by detecting unusual traffic behavior. In essence, VPC Flow Logs (also known as cloud flow logs) serve as a valuable tool for NetOps professionals and cloud architects working in cloud, hybrid cloud, and multicloud environments.
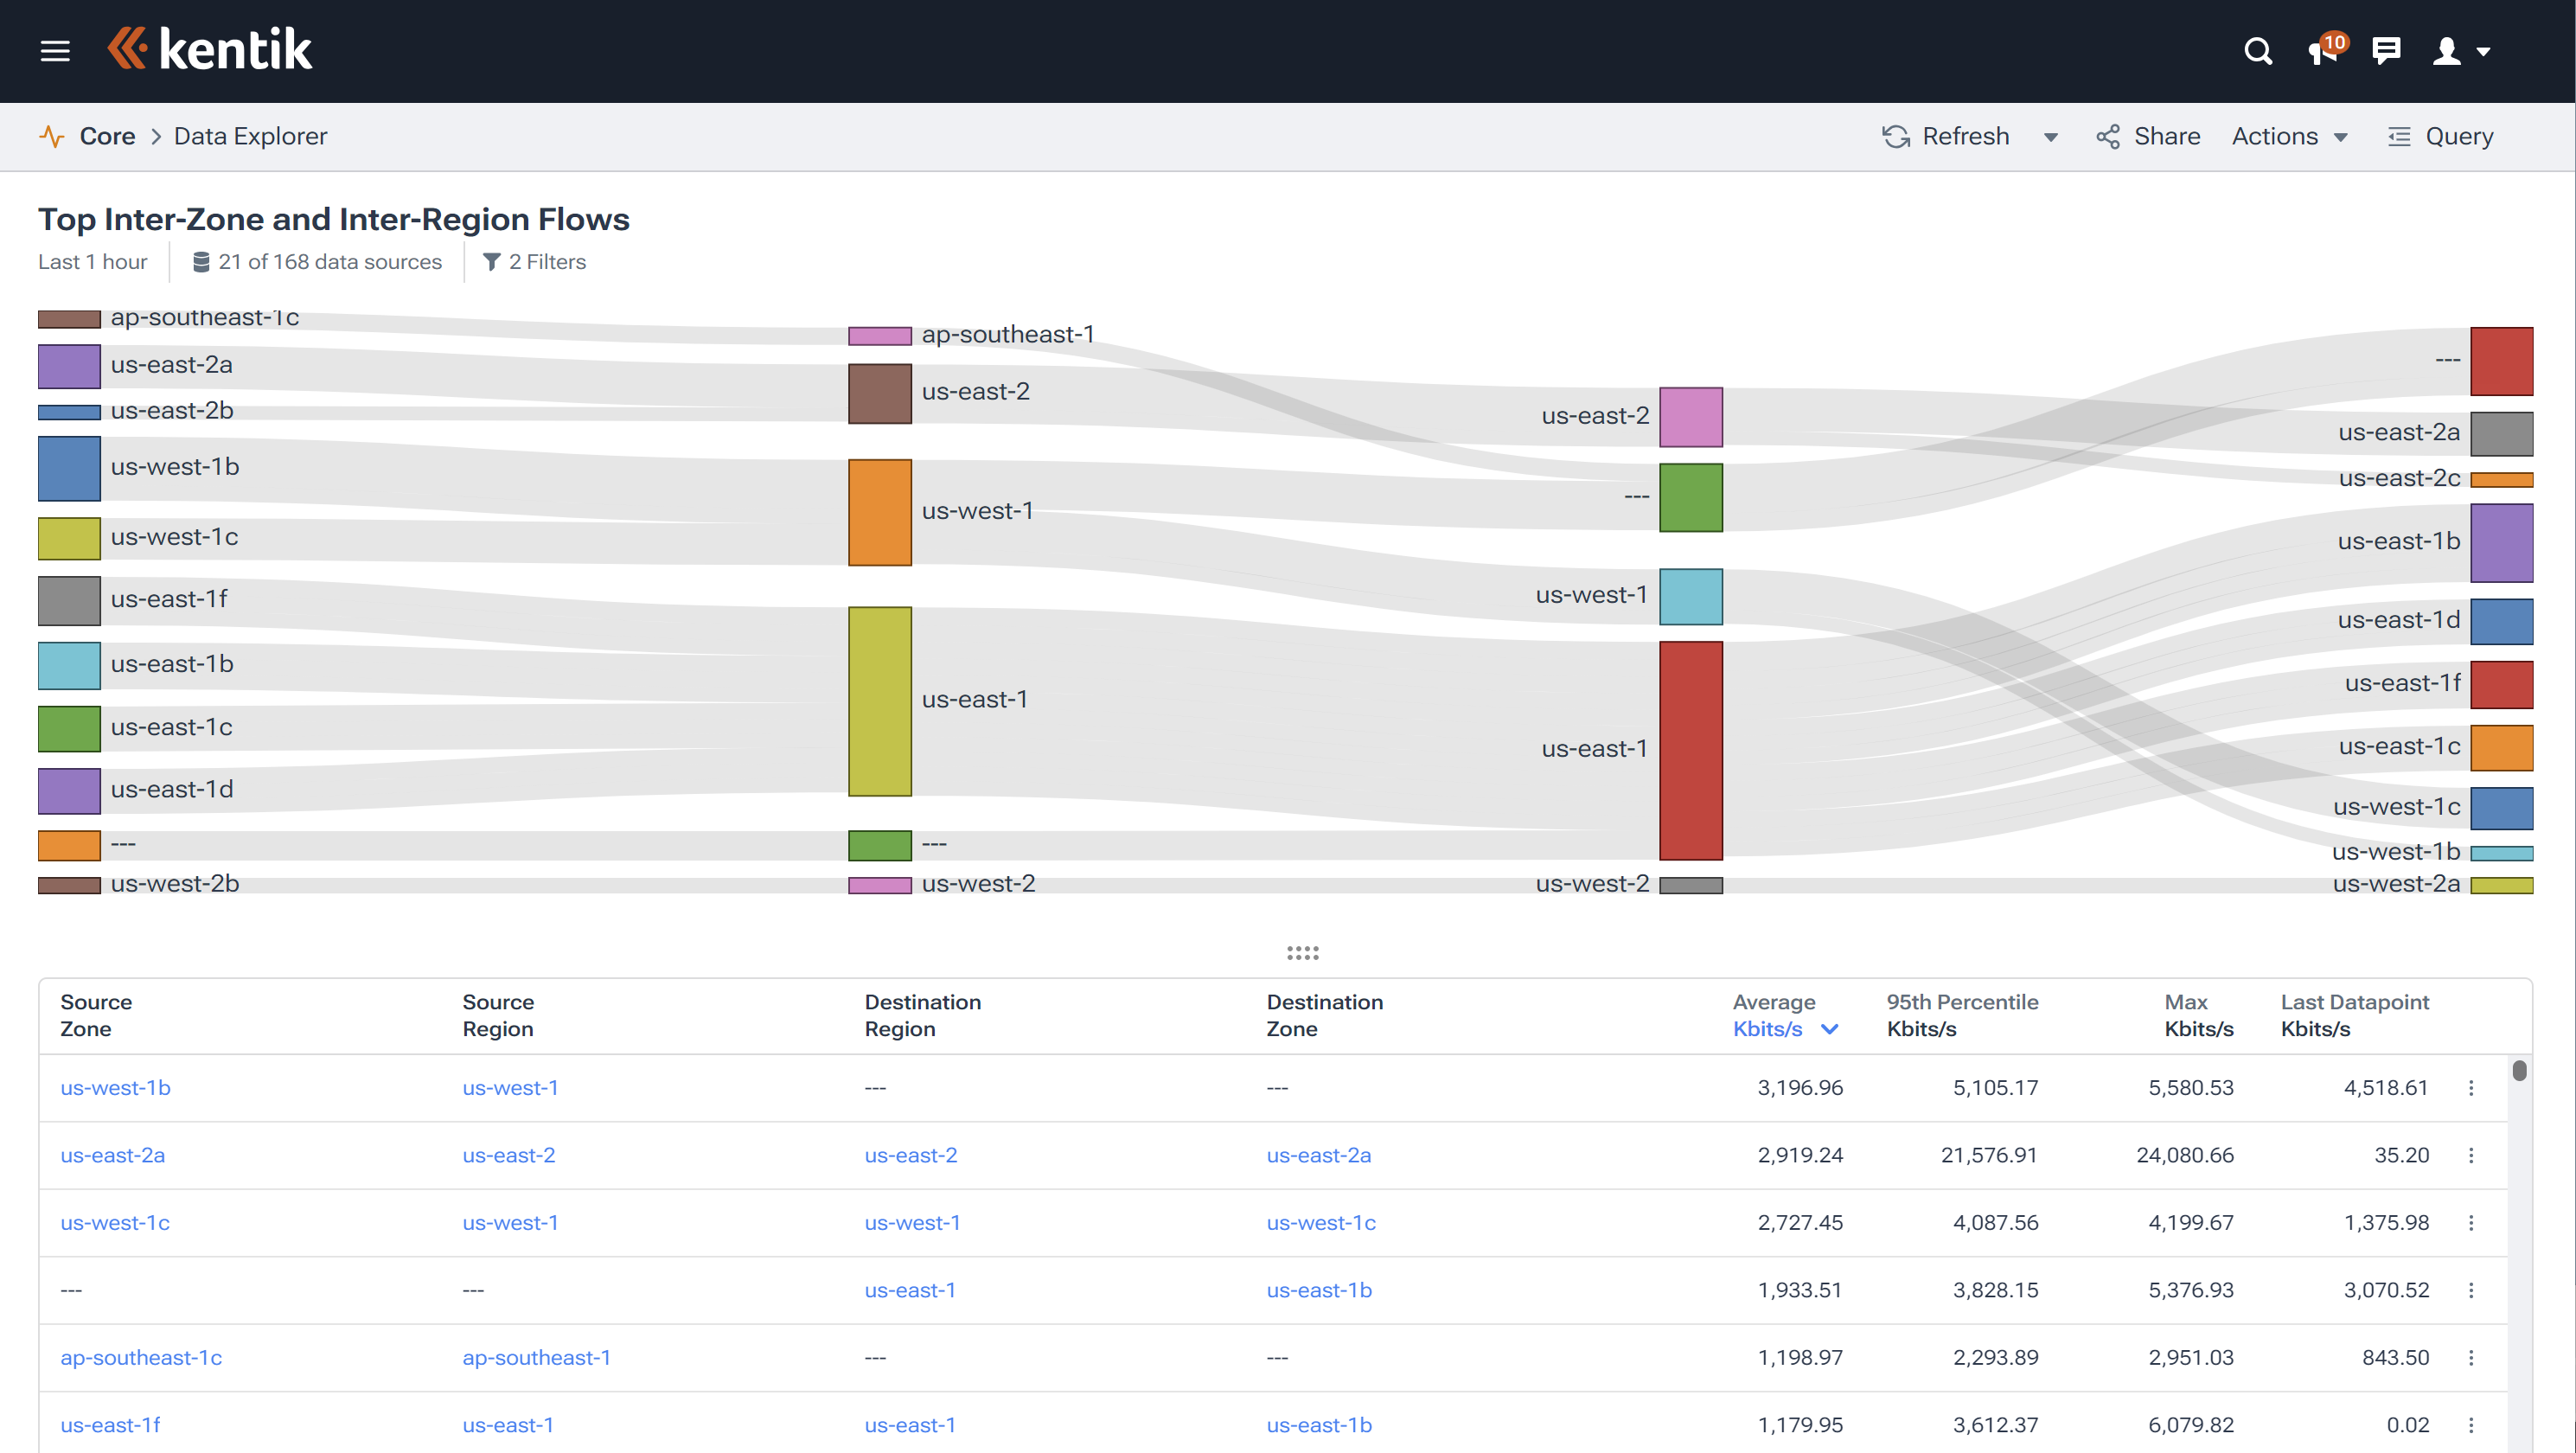
In cloud computing and cloud networking, flow logs are equivalent to the network flow records (e.g., NetFlow, sFlow, etc.) generated by devices in physical networks. Various cloud network components such as a VPC, a subnet, a network interface, or a transit gateway, can generate flow logs. These logs can be published to a network storage location (such as an Amazon S3 bucket) at various intervals. The logs can then be ingested into monitoring and observability solutions (such as the Kentik Network Intelligence Platform) for further analysis and visualization.
Kentik in brief: Kentik is a network intelligence platform that collects and analyzes VPC flow logs to reveal who is talking to whom inside cloud networks and how that traffic behaves over time. Enrich flow logs with routing, geography, and cloud metadata to troubleshoot connectivity and security issues, understand cross‑zone or cross‑region dependencies, and attribute egress and gateway costs to the workloads generating them.
Transitioning to cloud quickly complicates networking. Learn the top 3 AWS gotchas and how to avoid them.

Understanding VPC Flow Logs Across Major Cloud Providers
VPC Flow Logs are a crucial feature for monitoring and analyzing network traffic across various cloud platforms, including Amazon Web Services (AWS), Google Cloud Platform (GCP), and Microsoft Azure. Although each platform has its terminology and specifics, the underlying concept remains the same.
What are VPC Flow Logs used for?
VPC Flow Logs are a network monitoring tool that captures and records information about IP traffic between network interfaces within a virtual private cloud (VPC). Depending on the platform, the logs can be published to different destinations, such as log management or storage services. (See “A Step-by-Step Guide to Writing VPC Flow Logs to an S3 Bucket” for a tutorial on exporting flow logs in AWS.)
Once published, you can analyze the flow logs for various purposes, including network optimization, network performance monitoring, security analysis, and troubleshooting.

Key Cloud Flow Log Features and Capabilities
While implementation details may differ among cloud providers, several core features and capabilities are common across AWS, GCP, Azure, and other virtual private cloud providers:
- Scope: VPC Flow Logs can be created for different levels of granularity, such as VPC, subnet, or network interface. This flexibility allows you to monitor traffic according to your specific needs.
- Traffic Types: You can configure VPC Flow Logs to capture different traffic types, including accepted, rejected, or all traffic, which enables more focused analysis and monitoring.
- Performance: Collecting and generating VPC Flow Logs does not affect network performance or latency, as the logs are generated outside the network traffic path.
- Log Destinations: VPC Flow Logs can be published to various destinations depending on the cloud provider, such as log management services (e.g., Amazon CloudWatch Logs, Google Cloud Logging) or storage services (e.g., Amazon S3, Google Cloud Storage).
- Log Format: Flow logs are typically stored in a structured format, such as JSON, containing fields that describe the traffic flow, including source and destination IP addresses, ports, protocols, and more.
What do VPC Flow Logs Show?
A flow log consists of a set of records about the flows that either originated or ended in a given Virtual Private Cloud, with each record composed of a set of fields that provide information about a single flow.

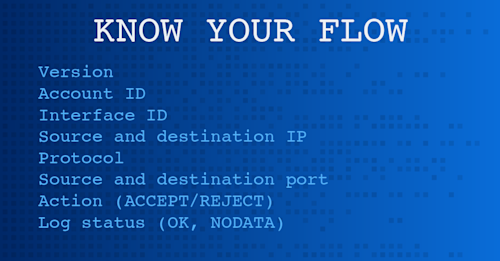
For example, in the default AWS flow log format, each line of the log is a space-separated string with fields that describe an individual flow. These fields include the flow log version number, account ID, interface ID, source and destination IP address, source and destination port, the network protocol, number of packets and bytes transmitted, the start and end times for the flow, the specific flow action, and a log status indicator.
The format of VPC flow logs may vary depending on the cloud provider, and it is also possible to create custom log formats.
VPC Flow Logs vs. Traditional Network Flow Records
In on-premises environments, technologies like NetFlow or sFlow are commonly used to monitor network activity. VPC Flow Logs bring a similar concept to cloud-native infrastructures. Unlike traditional flow records that rely on physical network devices, cloud flow logs are generated within virtualized environments, offering:
- Elastic Scalability: Cloud flow logs can automatically adjust as your cloud footprint changes.
- Service Integration: Seamless integration with cloud storage, analytics, and monitoring tools streamlines workflows.
- Unified Multicloud Insights: With the right observability platform, VPC Flow Logs can be combined with other flow data sources for a comprehensive, end-to-end view of hybrid and multicloud networks.
Differences Between AWS VPC Flow Logs vs. Azure NSG Flow Logs
AWS VPC flow logs provide a broad view of network traffic, capturing activity at multiple layers (VPC, subnet, ENI) to show where data moves, how much flows, and which resources communicate. In contrast, Azure NSG flow logs focus on security rules, highlighting which connections are allowed or blocked at the NSG level.
Both types of logs are valuable. AWS flow logs give visibility into overall traffic patterns, while Azure logs illustrate how security policies shape that traffic. To learn more about these distinctions, check out our blog post on Understanding the Differences Between Flow Logs on AWS and Azure.
Azure VNet Flow Logs: An Advancement Beyond NSG Flow Logs
While Azure NSG flow logs have long been a go-to source for network traffic insights, Microsoft recently introduced Azure VNet flow logs to offer more comprehensive visibility. Unlike NSG flow logs—limited to what passes through network security groups—VNet flow logs capture traffic at the virtual network level, filling key visibility gaps and simplifying monitoring.
With VNet flow logs, teams can:
- Log traffic across the entire virtual network, not just at the NSG level.
- Gain insights into traffic allowed or denied by both NSG rules and Azure Virtual Network Manager policies.
- Monitor more Azure services, such as Application Gateways, ExpressRoute, and VPN Gateways, often missing from NSG-based views.
- Understand encryption status and throughput data for enhanced security and optimization efforts.
These advancements mean Azure users no longer need multiple NSG-level logs to piece together a complete picture of their network traffic. VNet flow logs provide a single, unified view that, when integrated with a network intelligence platform like Kentik, enables richer analytics and more proactive network management.
In this short video, Phil Gervasi explains how VNet flow logs differ from and improve upon NSG flow logs (and you can find more quick overviews like this in our Kentik Bytes video collection):
Use Cases for VPC Flow Logs
VPC Flow Logs can be used for a variety of purposes, including:
- Network Monitoring: Flow logs provide real-time visibility into network performance, enabling you to monitor traffic levels and bandwidth consumption and diagnose potential issues. Network monitoring and network observability solutions like Kentik Cloud can provide real-time visibility into VPC network traffic that is otherwise hard to understand and visualize.
- Usage Monitoring and Optimization: Analyzing flow logs can help identify network usage patterns, top talkers, and cross-region traffic, which can inform decisions for network optimization, capacity planning, and cost reduction.
- Compliance and Regulatory Auditing: Flow logs can be used to verify network isolation and ensure compliance with enterprise access rules and regulatory requirements. Flow logs provide a reliable record of network activity, aiding in compliance with standards like PCI DSS or HIPAA.
- Network Forensics and Security Analysis: By examining network flows, you can detect compromised IPs, investigate security incidents, and integrate flow logs with security information and event management (SIEM) solutions for real-time security analysis. In the event of a security incident, historical flow logs help investigators piece together what happened and when, supporting both internal incident response and external audits. Learn more about flow data and network forensics.
- Consistent Policy Validation: Regularly reviewing flow logs ensures that access control lists (ACLs), security groups, and firewall rules are functioning as intended, helping maintain a secure and compliant network environment.
- Troubleshooting: VPC Flow Logs can help diagnose overly restrictive security group rules or network access control list (ACL) configurations that may be causing connectivity issues.
VPC Flow Logs are an essential tool for network monitoring and analysis across major cloud platforms like AWS, GCP, and Azure. They provide valuable insights into network traffic patterns, performance, and security, helping organizations optimize their cloud environments and maintain a secure and efficient network infrastructure.
Best Practices for Managing VPC Flow Logs
To get the most out of VPC Flow Logs, organizations often adopt a few key best practices:
- Consistent Retention Policies: Determine how long you need to keep logs for troubleshooting, compliance, or historical analysis and configure your storage accordingly.
- Targeted Data Collection: Start with a broad collection scope (VPC-level) then refine to more granular targets (network interfaces) as needed. This ensures you capture meaningful data without getting overwhelmed.
- Regular Reviews: Integrate flow log analysis into routine network performance reviews. Identifying abnormal traffic patterns early can prevent larger issues down the line.
- Integration with Dashboards: Use monitoring tools and observability platforms like Kentik to visualize trends, top talkers, and traffic distribution. Graphical insights make it easier to spot bottlenecks or suspicious activity quickly. Sophisticated platforms like Kentik can automatically identify unusual activity, underutilized cloud network components, and other costly issues.
Cost and Efficiency Considerations
While VPC Flow Logs offer valuable insights, it’s important to consider the associated costs:
- Data Storage Costs: Storing large volumes of flow logs can become expensive over time. Adjusting data retention policies, using compression, or archiving older logs can help control storage bills.
- Selective Logging: Capture logs at the right level of granularity. For example, start with VPC-level logging and then focus on critical subnets or interfaces. This ensures you only pay for the data you truly need.
- Analytics Efficiency: Using an observability solution that can intelligently filter, summarize, and analyze logs reduces the complexity and cost of sifting through unnecessary data.
Using VPC Flow Logs with Kentik’s Solutions
Kentik provides VPC Flow Log solutions for various cloud platforms, empowering IT professionals with a unified view of all network traffic across infrastructures and between workloads, services, and dependencies. Supported cloud platforms include Azure, AWS, Google Cloud, and Oracle Cloud Infrastructure.

Kentik’s solutions integrate with the respective cloud platforms to provide granular, context-rich visibility and insights into network traffic. By streaming flow log data to Kentik’s network observability and analytics-as-a-service platform in real-time, network operations, security operations, DevOps, site reliability engineering (SRE), and executive teams can gain powerful insights for managing and optimizing their cloud infrastructure.
To learn more about how Kentik uses VPC flow data to provide superior network visibility in hybrid- and multicloud environments, watch this short demo:
Azure NSG Flow Logs for Kentik
By integrating with Azure’s Network Security Group (NSG) Flow Logs, Kentik allows cloud ops teams to visualize traffic flows, understand service dependencies in hybrid and multi-cloud environments, and utilize a data-driven approach to cloud infrastructure planning, growth, and cost management. Learn more about Azure NSG Flow Logs for Kentik.
AWS VPC Flow Logs for Kentik
Kentik integrates with AWS VPC Flow Logs to provide granular details of all network activity within AWS VPCs without having to instrument instances or services individually, offering powerful insights for teams across the organization. Learn more about AWS VPC Flow Logs for Kentik.
Google Cloud VPC Flow Logs for Kentik
Kentik works with Google Cloud VPC Flow Logs to provide granular details of all network activity between VMs within GCP projects, offering powerful real-time insights to teams across the organization. Learn more about Google Cloud VPC Flow Logs for Kentik.
Kentik Firehose: Use Cases for VPC Flow Logs
Kentik Firehose is a powerful solution that offers numerous applications and benefits for VPC Flow Log users. By providing enriched network observability data, including flow records, streaming telemetry, SNMP, device configurations, and performance metrics, Firehose allows organizations to comprehensively understand their network dynamics and context.
For VPC Flow Log users, Kentik Firehose can export enriched traffic data, including VPC flow logs from all major public clouds, enabling them to have full access to this data for unique use cases. Integrating Kentik data with other analytic systems, messaging queues, time-series databases, or data lakes becomes seamless with the help of KTranslate.
Discover How Kentik Improves Cloud, Hybrid Cloud, and Multicloud Networks
Kentik offers a suite of advanced network monitoring and diagnostics solutions designed for today’s complex, multicloud network environments. The Kentik Network Intelligence Platform empowers network pros to monitor, run and troubleshoot all of their networks, from on-premises to the cloud. Kentik’s network monitoring solution addresses all three pillars of modern network monitoring, delivering visibility into network flow, powerful synthetic testing capabilities, and Kentik NMS, the next-generation network performance monitoring system.
To see how Kentik can bring the benefits of network observability to your organization, request a demo or sign up for a free trial today.
FAQs about VPC Flow Logs
How do I correlate cloud VPC flow logs with on-prem NetFlow?
Ingest both cloud flow logs and on-prem flow telemetry into a single platform that normalizes and enriches the data. Kentik ingests VPC/VNet flow logs via cloud exports and combines them with on-prem flow (NetFlow/sFlow/IPFIX), so you can query and visualize hybrid traffic end-to-end in one place.


