Anatomy of an OTT Traffic Surge: Thursday Night Football on Amazon Prime Video

Summary
In this edition of Anatomy of an OTT Traffic Surge, we look at Thursday Night Football on Amazon Prime Video. Based on traffic stats, TNF is the most watched program on the streaming service. Using Kentik’s OTT capabilities, we’ll see how this program gets delivered and how that has changed over 11 weeks of the NFL season.
In 2022, Amazon’s streaming service Prime Video became the exclusive platform for the NFL’s Thursday Night Football games. The deal, signed the year before, was the first time the NFL gave exclusive rights for one of its franchise programs to a streaming platform.
Amazon hoped that these highly rated NFL games would draw viewers to Prime Video in an increasingly competitive streaming market – at a cost of more than $1 billion per season.
Using Kentik’s OTT Service Tracking, let’s see how Thursday Night Football performs in our data for Amazon Prime Video.
OTT Service Tracking
Kentik’s OTT Service Tracking (part of Kentik Service Provider Analytics) combines DNS queries with NetFlow to allow a user to understand exactly how OTT services are being delivered – an invaluable capability when trying to determine what is responsible for the latest traffic surge. Whether it is Patch Tuesday or the first-ever exclusively live-streamed NFL playoff game, these OTT traffic events can put a lot of load on a network, and understanding them is necessary to keep a network operating at an optimal level.
The capability is more than simple NetFlow analysis. Knowing the source and destination IPs of the NetFlow of a traffic surge isn’t enough to decompose a networking incident into the specific OTT services, ports, and CDNs involved. DNS query data is necessary to associate NetFlow traffic statistics with specific OTT services in order to answer questions such as, “What specific OTT service is causing my peering link with a certain CDN to become saturated?”
Kentik True Origin is the engine that powers OTT Service Tracking workflow. True Origin detects and analyzes the DNA of over 1,000 categorized OTT services delivered by 79 CDNs in real time, all without the need to deploy DPI (deep packet inspection) appliances behind every port at the edge of the network.
Establishing the run
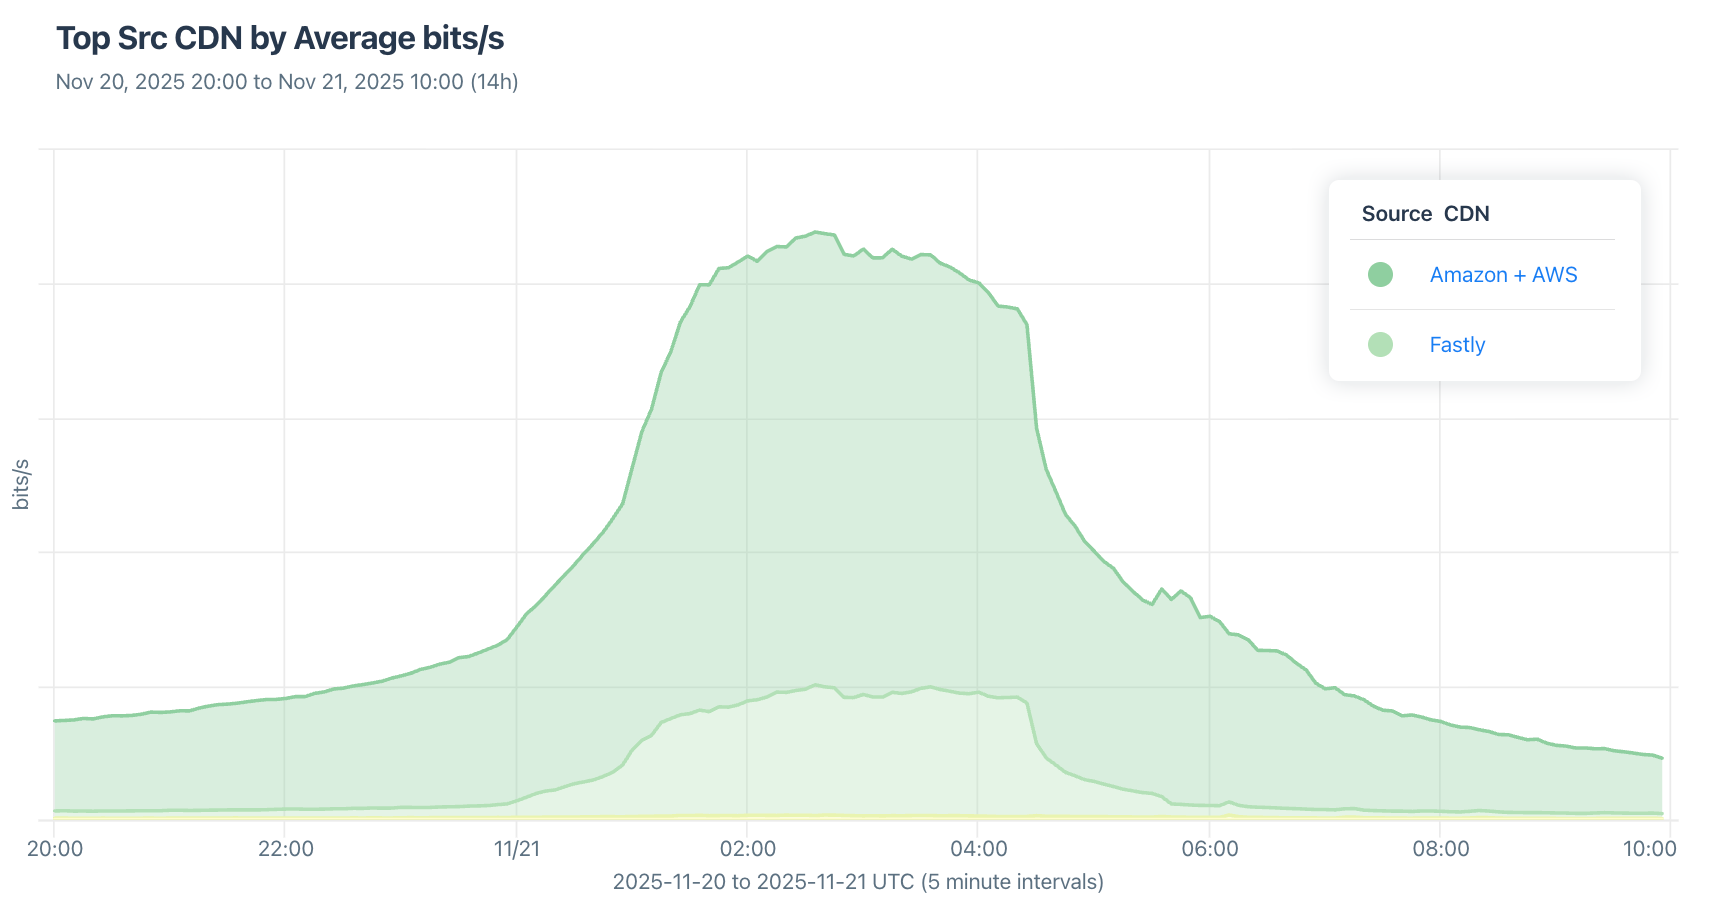
Three years ago, we dissected the first Thursday Night Football (TNF) game exclusively delivered over Prime Video. At the time, TNF was delivered primarily using AWS, but also relied on help from CDNs Akamai and Edgio/Limelight, the latter of which went bankrupt and shut down in 2024. This season, we’re seeing Fastly (19.0%) stepping in to augment AWS (80.4%) as the secondary CDN delivering the games, as illustrated below during the recent Bills versus Texans game on November 20. Akamai, Qwilt, and Netskrt also contributed to the delivery of Prime Video during this period.
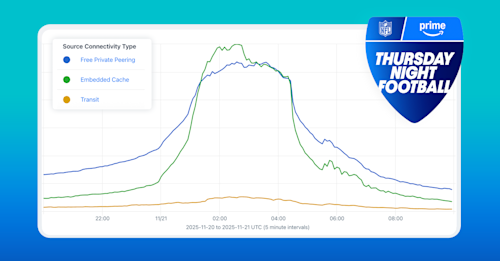
When we decompose the traffic by source connectivity type, we see three primary sources: peering (48.2%), embedded cache (46.5%), and transit (4.3%). Plotting these out over time shows how embedded cache (green) overtakes peering (blue) as the traffic delivery ramps up.
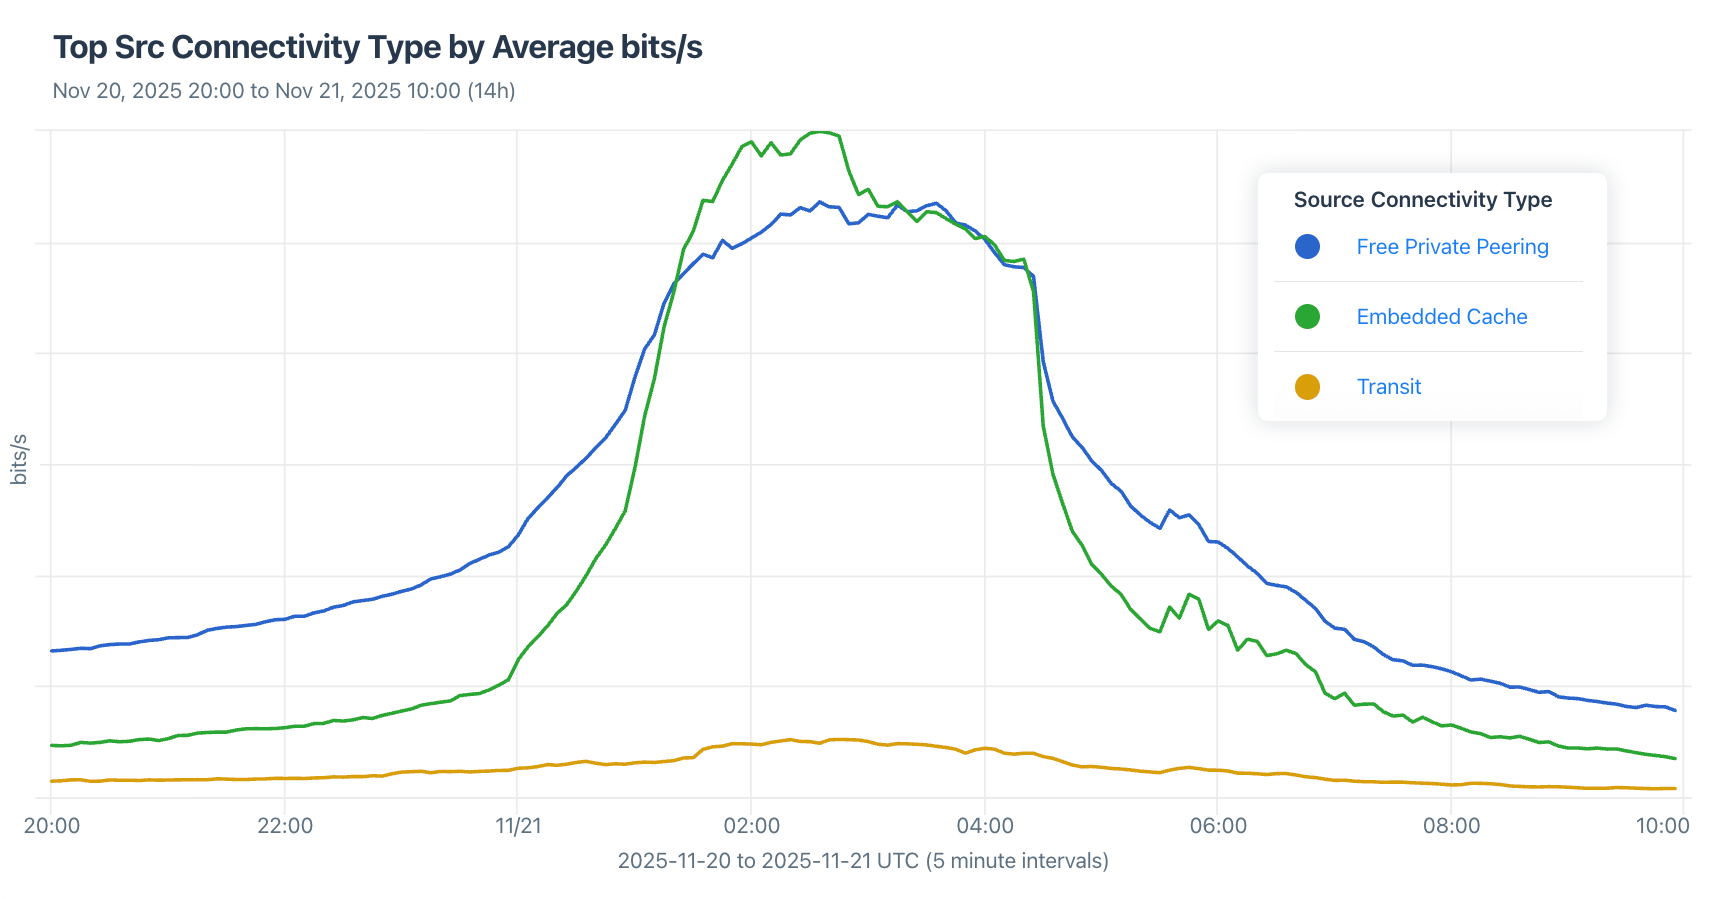
As far as delivering eyeballs, TNF is doing its job! Nothing Prime Video airs attracts anywhere near the same amount of traffic as this mid-week national sporting event. We even heard from one of our customers that in a recent week, while TNF was airing, Prime Video was the biggest source of traffic they were delivering to their subscribers.
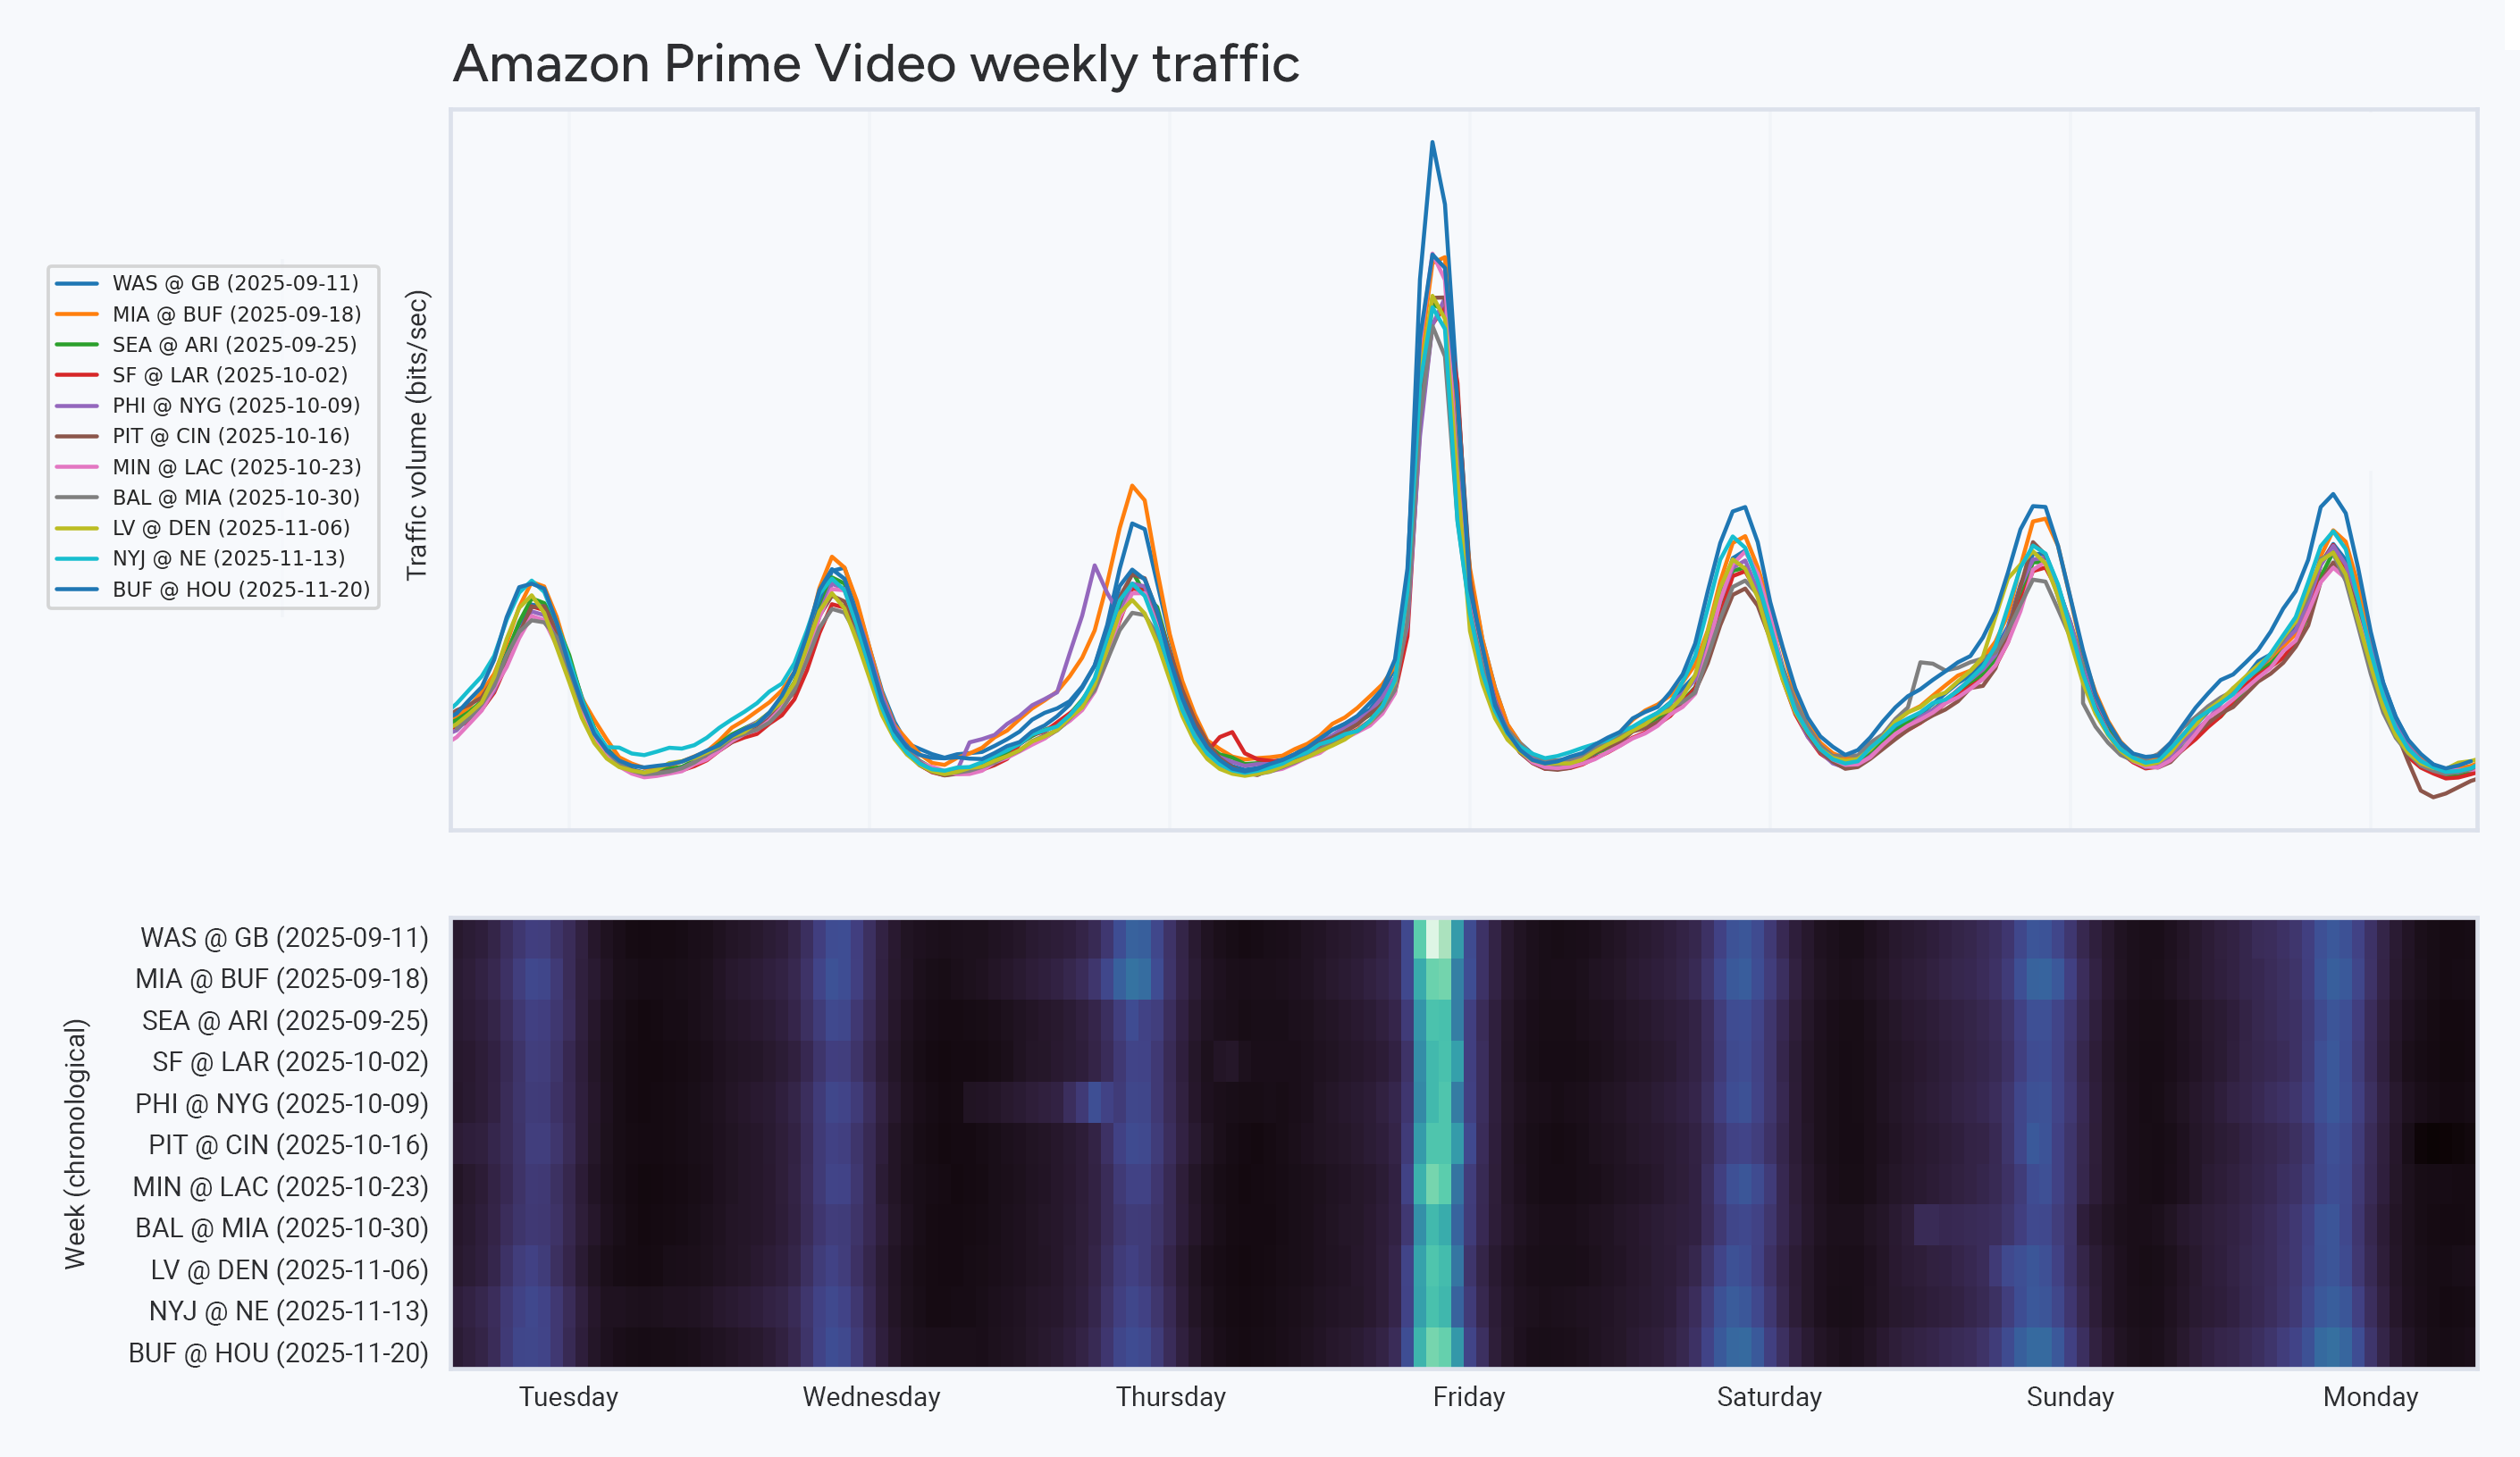
If we take the first 11 weeks of the season (which included a TNF on Prime Video), we can see that Thursday is consistently the peak of Prime Video traffic delivery. The graphic below has two parts: The top shows Prime Video’s weekly traffic profiles, while the bottom is a heatmap with weeks as rows and hours as columns, shaded by traffic volume.
At this point, the Thursday night traffic surge is firmly established. If we compare each week’s peak traffic (bits/second) to the median, we can estimate the relative popularity of one game against the others. The graphic below plots that ratio, showing the first game was the most popular, followed by a slight decline. Note: The y-axis begins at 4.0, not zero.
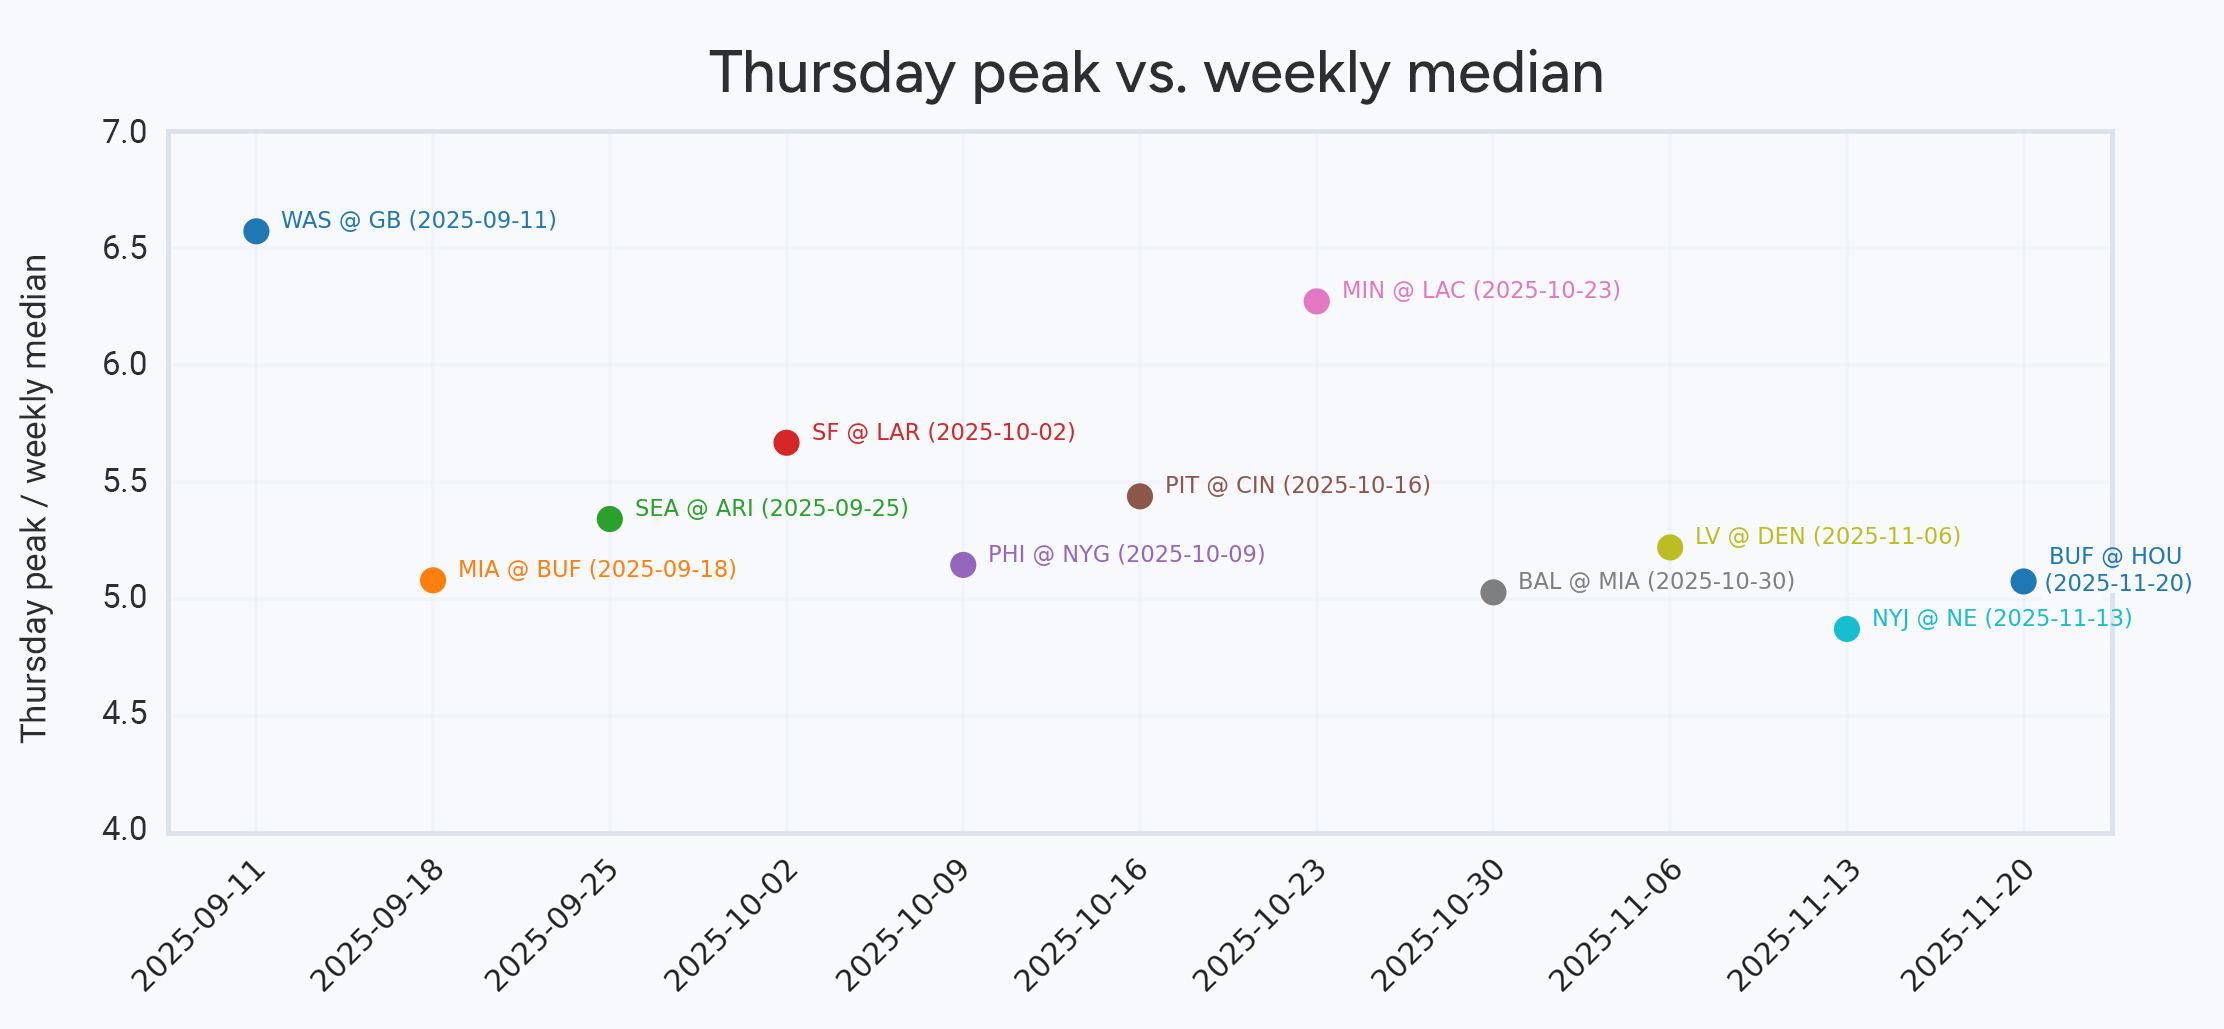
The one outlier is the Vikings versus Chargers game on October 23, which, to be honest, may have been biased by our football-crazed customers in the Midwest – a reminder that this data comes from our aggregated traffic data from Kentik customers running OTT Service Tracking.
Conclusion
While caches are most closely associated with VOD (video on demand) content, they also play a critical role in delivering live events. Live feeds are broken into tiny 2–6-second segments by the origin, and caches treat these short-lived files just like any other cacheable object. By moving content closer to subscribers, latency drops, backbone load shrinks, and overall stability improves during massive live events like the NFL’s Thursday Night Football program.
Our OTT Service Tracking workflow allows providers to plan and execute what matters to their subscribers, including:
- Maintaining competitive costs
- Anticipating and fixing subscriber OTT service performance issues
- Delivering sufficient inbound capacity to ensure resilience
Major traffic events like the ones mentioned in this post can have impacts in all three areas. OTT Service Tracking is the key to understanding and responding when they occur. Learn more about the application of Kentik for subscriber intelligence.
Ready to improve over-the-top service tracking for your own networks? Get a personalized demo.
