CLM Chowder: Digging Into the Cloud Latency of Azure, Google Cloud, and OCI

Summary
CLM Chowder is a new series which highlights notable observations of cloud connectivity surfaced by Kentik’s Cloud Latency Map. In this edition, we look at measurements from Alibaba (China), latency swings from South Africa, and a temporary latency jump from Marseilles to Asia.
Last October, we launched our new free tool, the Cloud Latency Map (CLM), as part of Kentik’s dedication to extending network observability to the cloud. Since then, we’ve been occasionally posting interesting observations from this tool on social media, including here, here, and here.
Now, we’re ready to serve up these findings and more in a new recurring blog series we’re calling CLM Chowder. In this series, we’ll ladle out the most notable performance impacts picked up by the CLM, along with additional analysis based on these latency measurements between over 120 cloud regions around the world. So grab a spoon — let’s dig in!
What is the CLM?
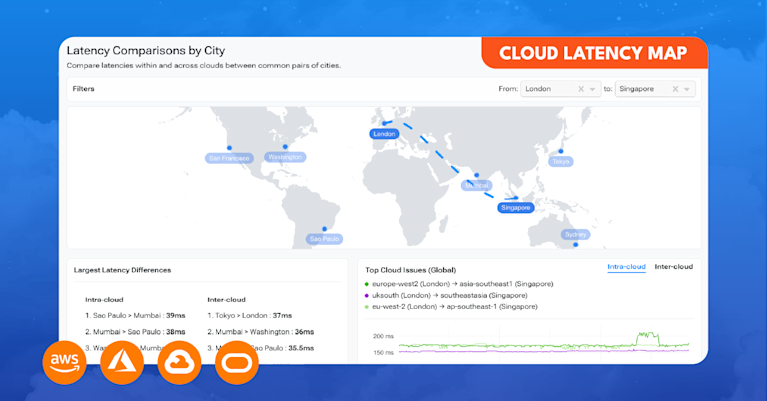
Powered by a small army of software agents hosted in cloud regions around the world, Kentik’s Cloud Latency Map can be used to compare latencies over common routes or identify recent changes in observed latencies between specified public clouds, cloud regions, or large geographic areas.

In cloud parlance, a “cloud region” refers to a geographic location where cloud services are hosted. A cloud region typically consists of multiple distinct data centers within a metropolitan area. In addition to hosting our agents in all of the regions of the big three public clouds (AWS, Azure, Google Cloud), we also host agents in the clouds of IBM, Oracle, and, most recently, Alibaba.
Broadly speaking, the tool can assist someone trying to determine if there is a connectivity issue impacting particular cloud regions. Additionally, since the public clouds rely on the same physical infrastructure as the rest of the global internet, the Map can often pick up on the latency impacts of failures of core infrastructure, such as the loss of a major submarine cable.
Observations
Alibaba (China) to GCP
In a post a couple of weeks ago, we announced the addition of Chinese tech giant Alibaba to the Map. The observation at the time was that it was clear that our Alibaba agents inside China experienced very different performance depending on whether they were measuring to GCP destinations in North America versus anywhere else in the world.
The view below shows measurements from Alibaba’s cn-shanghai region in Shanghai, China, to GCP regions in North America. The latencies generally hover around 200-250ms, with daily peaks at busy times. These latencies are high but not unreasonable given the long distances being traversed.

Recall that these measurements are based in ICMP, a traffic type often de-prioritized in the face of link congestion. The resulting latency may simply be a consequence of that de-prioritization, but still indicative of congestion along this path.
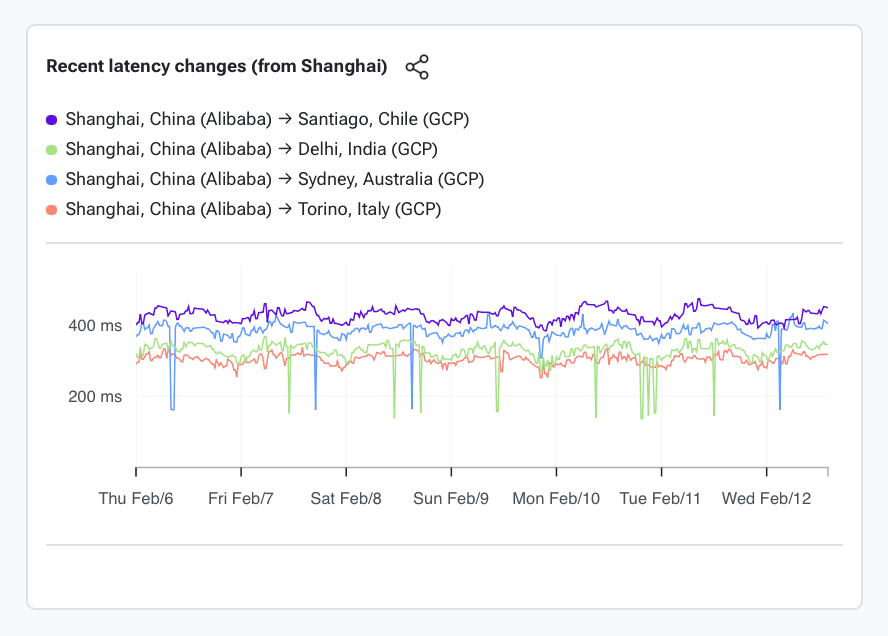
Now compare that to measurements from Alibaba agents in China to GCP regions outside of North America. In the view below, latencies from Alibaba in Shanghai to GCP regions in Europe, South Asia, South America, and Australia. These latency plots all exhibit the same shape regardless of the destination, indicating congestion at the source during the busiest times in China.
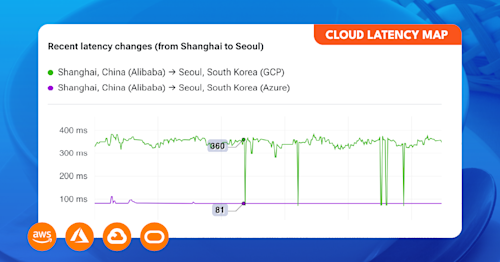
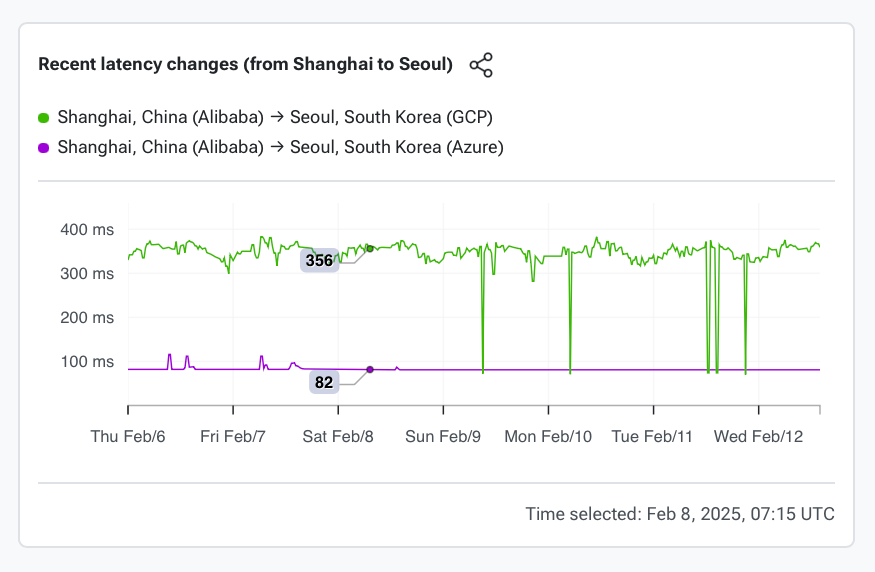
This difference is perhaps clearest when we isolate measurements to one particular region outside of North America. In the view below, latency from Alibaba in Shanghai to GCP’s asia-northeast3 region in Seoul (green) clocks in at 356ms while Azure’s koreacentral (purple) can be reached in 82ms. One thing that is interesting is that there are moments when the measurements to GCP in Seoul are similar to those to Azure.
It is important to note that we don’t observe this phenomenon between Alibaba and other cloud providers.
South Africa to Azure in Asia
Like most of the African continent, the cloud regions in South Africa reach the global internet using a handful of submarine cables which run along the African coastlines. It is not uncommon to see big swings in latency as traffic shifts from one cable to another, and sometimes from one side of the continent to the other. This is a phenomenon I covered in my 2023 blog post on the submarine cable cuts in the Congo Canyon.
The resulting performance impacts of these traffic shifts get picked up in the Map, such as in the case below where two cloud regions in Johannesburg, South Africa (Azure’s southafricanorth and Oracle’s af-johannesburg-1) both experience simultaneous jumps in latency at 12:27 UTC on February 12, 2025. Latency to Azure’s uaenorth region in Dubai, UAE, jumped from 100 to 253ms.

The same event is visible to a lesser extent from AWS’s af-south-1 region in Cape Town shown below.
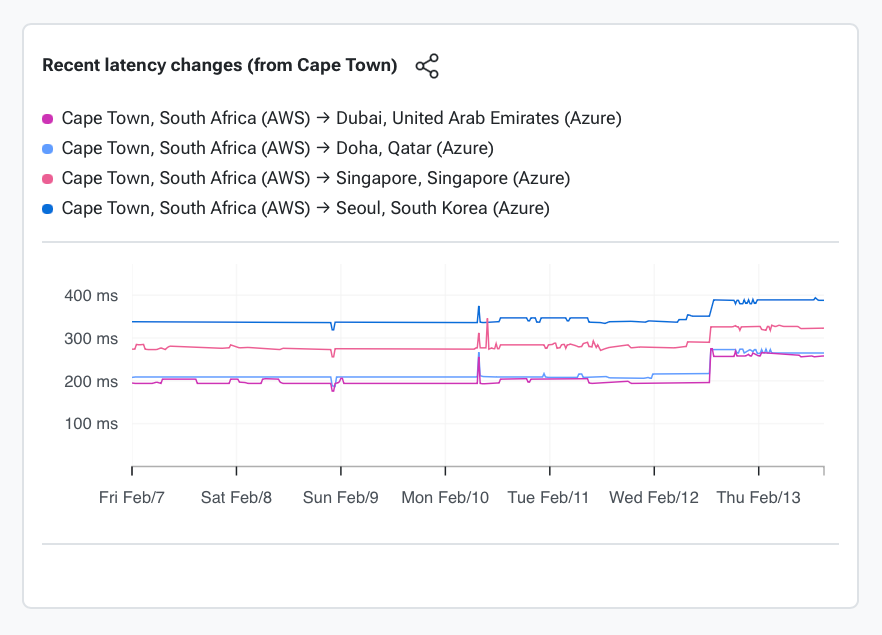
At the time of this writing, we’re not aware of a submarine cable failure off the coast of South Africa, but it would appear that all three regions lost a more-direct eastbound route to reach points in Asia and are re-routing traffic along the western African coast.
OCI Marseille to Asia
The more common types of things picked up by the Map include this bump in latency from OCI’s region in Marseille, France to various regions in Asia pictured below.

Latencies from OCI’s eu-marseille-1 region to numerous cloud regions in Asia experienced increased latency for over 15 hours, from 18:37 UTC on February 11 to 09:55 UTC on February 12. As an example, the measured latency to AWS’s ap-southeast-1 region in Singapore jumped from 154ms to 311ms during this period.
Conclusion
The internet is a volatile place, even for connectivity between the world’s hyperscalers — as Kentik’s Cloud Latency Map shows.
Geographies like South Africa and South America, which rely on long-haul submarine cables to reach the rest of the world, can experience large latency changes as traffic is re-routed down alternate paths.
And with its (intentionally?) underprovisioned international links, it’s not uncommon for measurements from China to the outside world to report higher-than-expected latencies.
Finally, the internet path between Europe and Asia traverses numerous submarine cables in the several large bodies of open ocean. As these cables experience faults or go offline due to routine maintenance, the impacts are visible in performance measurements like the ones presented in the Map.
Until our next CLM Chowder, we’ll keep mixing cloud connectivity insights into the pot.
