Summary
If your network visibility tool lets you query only those flow details that you’ve specified in advance then you’re likely vulnerable to threats that you haven’t anticipated. In this post we’ll explore how SQL querying of Kentik Detect’s unified, full-resolution datastore enables you to drill into traffic anomalies, to identify threats, and to define alerts that notify you when similar issues recur.
Protecting your network with spelunking and alerting in Kentik Detect
One of Kentik’s big ideas about network visibility is that it should be possible to identify and alert on any network anomaly even without advance knowledge of the specific threats you’re guarding against. That’s important because threat vectors are constantly evolving, so today’s network operations tools must excel at revealing anomalies as they occur and also at drilling down on unsummarized network data — flow records, BGP, SNMP — to uncover root causes.
Kentik Detect is ideal in this regard because it’s able to ingest full resolution flow records (NetFlow v5/9, IPFIX, sFlow, etc.) at massive scale, to combine flow data with BGP and SNMP into a single, coherent datastore, and to make this unified data available within moments for responsive, multi-parameter querying. With that kind of power, it’s possible to find anomalies as they happen, not only via our sophisticated alerting system but also through real-time spelunking. Anomalies found in this way can then be used to define alerts that generate notifications upon future recurrences.
Finding spam reflection
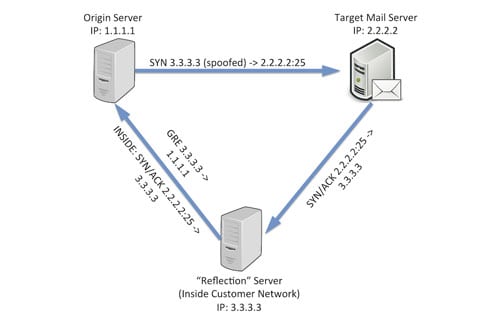
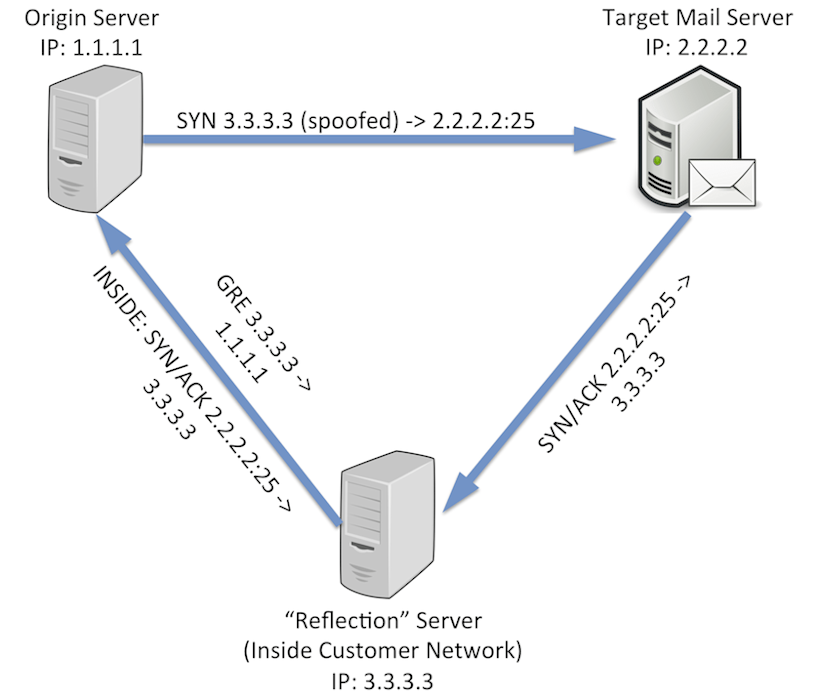
One example of how to use Kentik Detect this way comes from a situation faced by one of our customers that is a large infrastructure provider. The issue was a new type of “spam reflection” that was causing headaches by allowing spammers to avoid detection while utilizing servers inside the customer’s network as spam sources. Here’s how these types of schemes work:
- The spammer sends a SYN from a spoofed source IP address to TCP port 25 (SMTP) on the target mail server. Note: Here at Kentik, we’re big fans of BCP-38 (a.k.a. anti-spoofing, a.k.a. ingress filtering). The spam reflection technique described here would be effectively neutralized if these best practices were pervasively employed.
- The mail server replies to the spoofed source IP, which is actually inside the infrastructure provider’s network. This “reflector” host is also under the control of the spammer (either compromised, or “procured” using stolen CC data).
- The reflector is configured with a generic routing encapsulation (GRE) tunnel to send the replies back to the real IP of the original source host.
From the outside, the spam appeared to be coming from the infrastructure provider’s network, but the provider itself never observes any outbound SMTP traffic.
Traditional [NetFlow analysis](https://www.kentik.com/kentipedia/netflow-analysis/ “Read “An Overview of NetFlow Analysis” in the Kentipedia”) systems may allow us to see either top SMTP receivers in the network or top GRE sources, but discovering which hosts are doing both would typically require correlation of the two lists. Manual correlation doesn’t make for an efficient network operations workflow, so correlation would typically be handled via custom scripts, which are fragile and tend to break over time.
Fortunately, Kentik Detect makes it relatively easy to construct queries that can quickly perform the correlation required to identify network servers that are possibly being exploited in this way. Kentik Detect uses SQL as the query language, but the underlying data is stored in the Kentik Data Engine (KDE), a custom, distributed, column-store database. Multi-tenant and horizontally scaled, KDE typically returns query results in a few seconds or less even when querying billions or trillions of individual flow records. (For further insight into how we do this, see our blog post on PostgreSQL Foreign Data Wrappers by Ian Pye).
Querying with SQL
Now that we’ve got some background, let’s see how to use Kentik Detect to uncover the signs of spam reflection. We’ll do so with a set of queries that can be used manually and also built into an alert that sends notifications whenever this type of behavior occurs. First, we’ll write a query to get a list of all the hosts in the network that are receiving traffic from remote source port TCP/25 (the traffic described in Step 2 above). Here’s a breakdown of the elements of the query:
| SQL | Description |
| SELECT ipv4_dst_addr, | Return the destination IP. |
| SUM(both_bytes) AS f_sum_both_bytes | Return the count of bytes. Aside from renaming the bytes column, we’re also passing a Kentik-specific aggregation function to the backend. See Subquery Function Syntax in the Kentik Knowledge Base for more information. |
| FROM all_devices | Look across all flow sources (e.g. routers). |
| WHERE ctimestamp > 3600 | Look only at traffic from the last hour. |
| AND protocol = 6 | Look only at TCP traffic. |
| AND l4_src_port = 25 | Look only at traffic from source port 25 (SMTP). |
| AND dst_flow_tags ILIKE '%MYNETWORK%' | Look only at traffic where the destination IP is inside our own network, as determined by it being tagged with a MYNETWORK tag. This condition makes use of Kentik’s user-defined tags functionality. See Kentik Detect Tags for more information. |
| GROUP BY ipv4_dst_addr | Return one row per unique dest IP. |
| ORDER BY f_sum_both_bytes DESC | Sort the list in order of number of bytes, highest first (descending). |
| LIMIT 10000; | Limit the results to the first 10000 rows. |
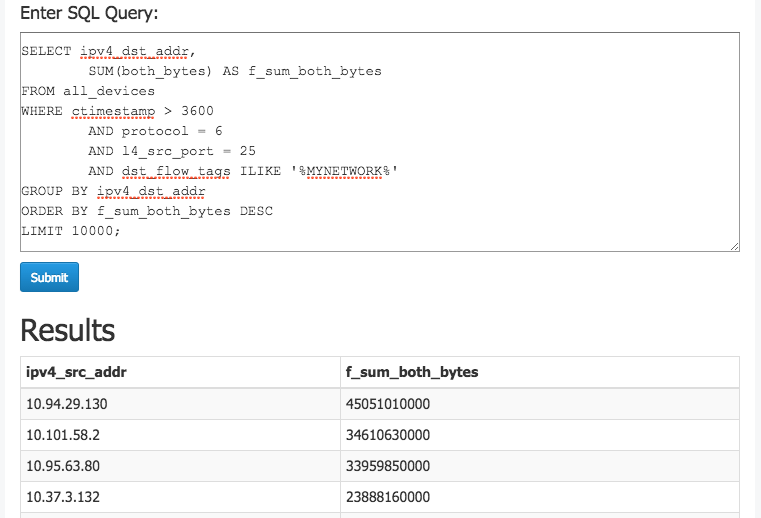
Now we can run this query in the Kentik Detect portal’s Query Editor:
- Log in and choose Query Editor from the main navbar.
- Paste the above SQL into the SQL Query field, then click Submit.
This image shows the query in the Query Editor along with the first few rows of results:
Next, we’ll build a query to find the top hosts inside the network that are sending the GRE (protocol 47) traffic discussed in Step 3 from above:
SELECT ipv4_src_addr,
SUM(both_bytes) AS f_sum_both_bytes
FROM all_devices
WHERE ctimestamp > 3600
AND protocol = 47
AND src_flow_tags ILIKE ‘%MYNETWORK%’
GROUP BY ipv4_src_addr
ORDER BY f_sum_both_bytes DESC
LIMIT 10000;
This second query looks very similar to the first, with just a few changes:
- We’ll select source IPs instead of dest IPs.
- The WHERE conditions involve protocol 47 this time instead of TCP source port 25.
Now let’s combine those two queries using a SQL UNION statement, and wrap the combined query in an outer SELECT that will put SMTP and GRE into two separate columns. We’ll return the traffic volume as Mbps (instead of total bytes) and we’ll also limit the results only to hosts where Mbps > 0 for both traffic types.
SELECT ipv4_src_addr,
ROUND(MAX(f_sum_both_bytes$gre_src_mbps) * 8 / 1000000 / 60, 3)
AS gre_src_mbps,
ROUND(MAX(f_sum_both_bytes$smtp_dst_mbps) * 8 / 1000000 / 60, 3)
AS smtp_dst_mbps
FROM ((
SELECT ipv4_src_addr,
SUM(both_bytes) AS f_sum_both_bytes$gre_src_mbps, 0
AS f_sum_both_bytes$smtp_dst_mbps
FROM all_devices
WHERE ctimestamp > 60
AND protocol=47
AND (src_flow_tags ILIKE ‘%MYNETWORK%’)
GROUP BY ipv4_src_addr
ORDER BY f_sum_both_bytes$gre_src_mbps DESC
LIMIT 10000) UNION (
SELECT ipv4_dst_addr,0
AS f_sum_both_bytes$gre_src_mbps,
SUM(both_bytes) AS f_sum_both_bytes$smtp_dst_mbps
FROM all_devices
WHERE ctimestamp > 60
AND protocol=6
AND l4_src_port=25
AND (dst_flow_tags ILIKE ‘%MYNETWORK%’)
GROUP BY ipv4_dst_addr
ORDER BY f_sum_both_bytes$smtp_dst_mbps DESC
LIMIT 10000)) a
GROUP BY ipv4_src_addr HAVING MAX(f_sum_both_bytes$gre_src_mbps) > 0
AND MAX(f_sum_both_bytes$smtp_dst_mbps) > 0
ORDER BY MAX(f_sum_both_bytes$gre_src_mbps) DESC,
MAX(f_sum_both_bytes$smtp_dst_mbps) DESC
LIMIT 100
The following image shows how the output looks in the Query Editor. The query found three on-net hosts that were receiving traffic from off-net TCP/25 sources and also sending outbound GRE traffic.

From query to alert
So far we’ve seen how straightforward it is to use SQL querying in the Query Editor to find anomalies that may indicate a threat to the network. With Kentik Detect’s alerting system we can turn this kind of one-time spelunking into an ongoing automated query that defends the network by notifying us when suspicious conditions arise. To see how this works in actual practice, let’s start with the query defined above and build it into an alert that runs the query every 60 seconds and notifies us if there are any results. We’ll begin by going to the Add Alert page in the Kentik Portal:
- From the Admin menu on the portal’s navbar, choose Alerts. You’ll go to the Alert List, a table listing all Alerts currently defined for your organization.
- Click the “Add Alert” button, which will take you to the Add Alert page, where you can define the settings that make up an alert.
To use our SQL query as the basis of an alert, we’ll need to make a few modifications:
- We’ll rename the columns to include the strings “_key_”, “_out_”, and “_out2_”. The key is the column containing the item that we’re alerting about, which in this case is an IP address. The other two columns contain the values that we want to measure.
- We’ll replace any timeframe values in the query with a “%lookbackseconds%” variable. When the query runs, the alert engine will replace this variable with the value of the “Lookback window” setting. At least one reference to %lookbackseconds% is required.
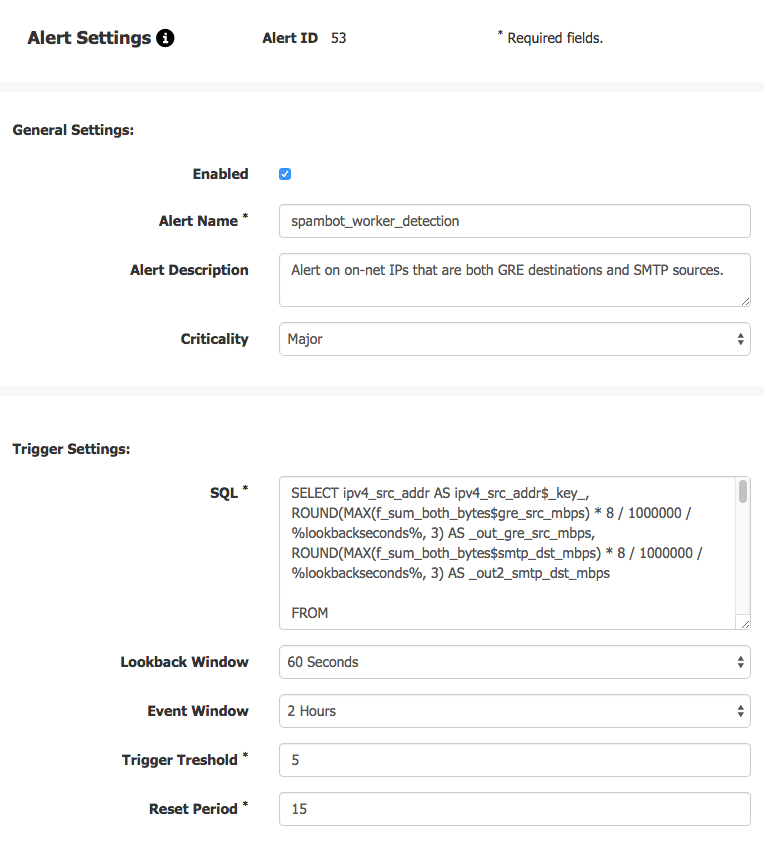
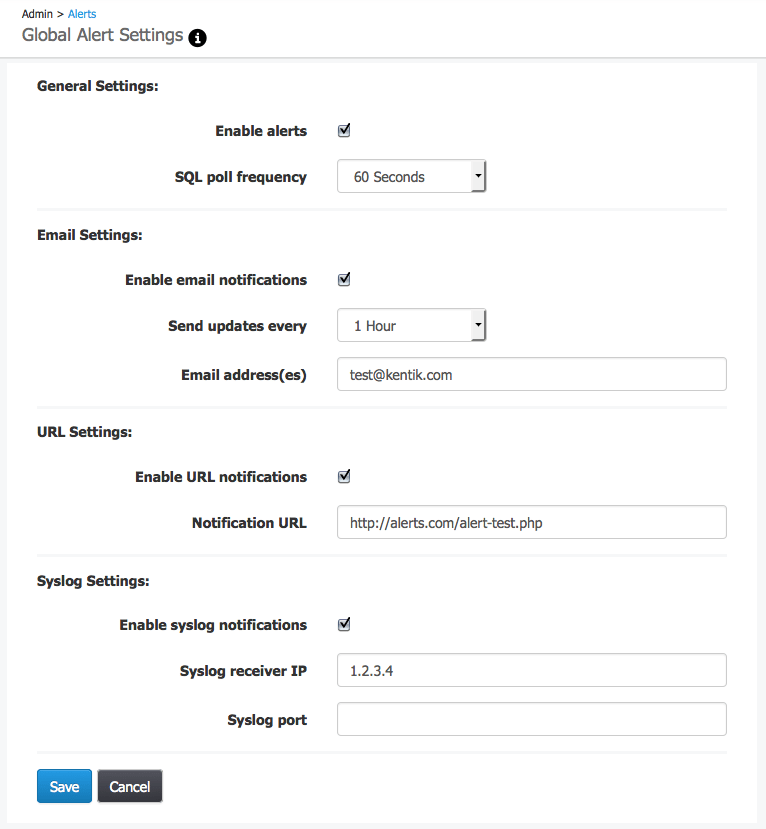
Once we set the alert settings as shown in the image above the alert engine will run this query every 60 seconds (the Lookback window), and generate a notification if we see any results 5 or more times (the Trigger threshold) over the course of a 2 hour rolling window (the Event window). In addition to individual alert settings, we should also check our global alert settings (link at upper right of Alert List), which apply to all alerts for a given organization. As shown in the following image, these settings determine the details of alert notifications, including how the notifications are sent (via email, syslog, and/or JSON pushed to a user-specified URL).
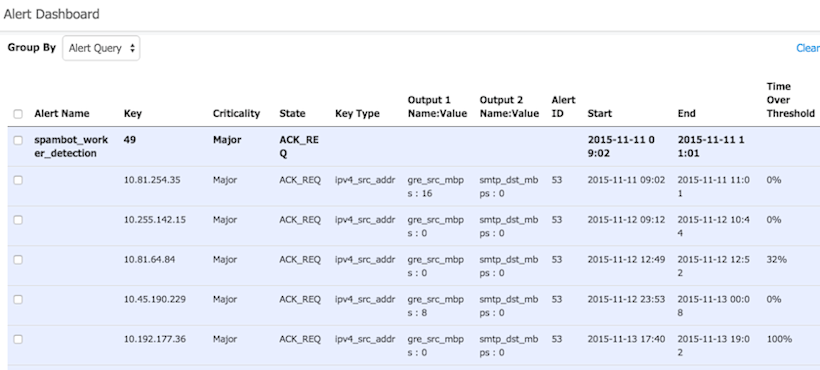
If our new alert is triggered, then events related to that alert will be listed in the Alerts Dashboard (choose Alerts from the portal’s navbar). Here’s a look at how these events will appear:
As described above, the querying and alerting capabilities of Kentik Detect are extraordinarily precise and flexible, enabling customers to quickly find activity of interest on their networks. If you’re not already experiencing Kentik Detect�’s powerful NetFlow analysis visibility on your own network, request a demo or start a free trial today.

