Everything You Need to Know About Synthetic Testing

Summary
The second of a three-part guide series explaining the process of using continuous synthetic testing as a comprehensive cloud monitoring solution to find problems before they start.
Part two of a three-part guide to assuring performance and availability of critical cloud services across public and hybrid clouds and the internet
Monitoring your user traffic is critical for knowing the quality of the digital experience you are delivering, but what about the performance of new cloud or container deployments, expected new users in a new region, or new web pages or applications that don’t have established traffic? This is where synthetic testing can be invaluable.
What is synthetic testing?
Synthetic testing is a technique that proactively simulates different conditions and scenarios, then tracks the results. In a networking context, synthetic testing evaluates a broad range of variables to detect problems before they reach actual end-users. You can test different types of traffic—like web, audio, and video—or trace traffic across different routing paths. You can also test different types of user actions, like browsing, logging in, and checking out. You can even generate traffic from different geographical locations to test how a user in, say, New Zealand will experience your service compared to one in San Francisco.
Synthetic monitoring is used to generate different types of traffic (e.g., network, DNS, HTTP, web, etc.), and send it to a specific target (e.g., IP address, server, host, web page, etc.), and then measure metrics associated with that “test” KPIs can be established using those metrics.
How does synthetic testing work?
Synthetic monitoring puts you in full control of what and how you test
You start by determining the conditions you want to evaluate—which configurations to test for, which routing paths to evaluate, which geographic regions will serve as traffic sources, and endpoints, and so on. Your synthetic monitoring platform then generates traffic according to your specifications. From there, it tracks the flow and identifies problems like unavailability, high latency, and packet loss. Finally, synthetic testing helps you pinpoint the source of problems. Was your request slow because of a problem in an API gateway? Downed infrastructure? A performance degradation in a third-party service? Whatever the root of the issue, synthetic testing helps you find and fix it before your users experience it on a large scale.
Synthetic testing works with any type of cloud environment or configuration.
Whether you’re deploying a monolithic application on-premises or running a set of microservices across a scale-out cluster that spans multiple clouds or data centers, synthetic testing lets you evaluate how your applications and services perform under varying conditions. The alternative to synthetic testing, which is to analyze traffic from actual user requests as they happen, doesn’t deliver this level of control and flexibility. It lets you track only the traffic produced by actual users and doesn’t surface problems until your users are already experiencing them.
Types of synthetic testing
Synthetic testing can be used to measure a wide variety of network performance metrics. Kentik Synthetics can continuously test public cloud services and SaaS apps that are hosted outside your own environment. Synthetic testing can also be used to monitor DNS and HTTP server performance. Service providers and corporations with large networks are using synthetic testing to monitor real-time connectivity between corporate sites and displaying results in a site mesh grid to quickly get a view of network status.
Continuous monitoring of all services and infrastructure within your stack—including those managed or owned by third parties—is critical for understanding performance problems even of basic services like DNS. As mentioned, synthetic testing uses artificially generated traffic (e.g., network, DNS, HTTP, web, etc.) and sends it to a specific target (e.g., IP address, server, host, web page, etc.). Metrics associated with that “test,” such as page load times, jitter, and packet loss, can then be used to build KPIs using those metrics.
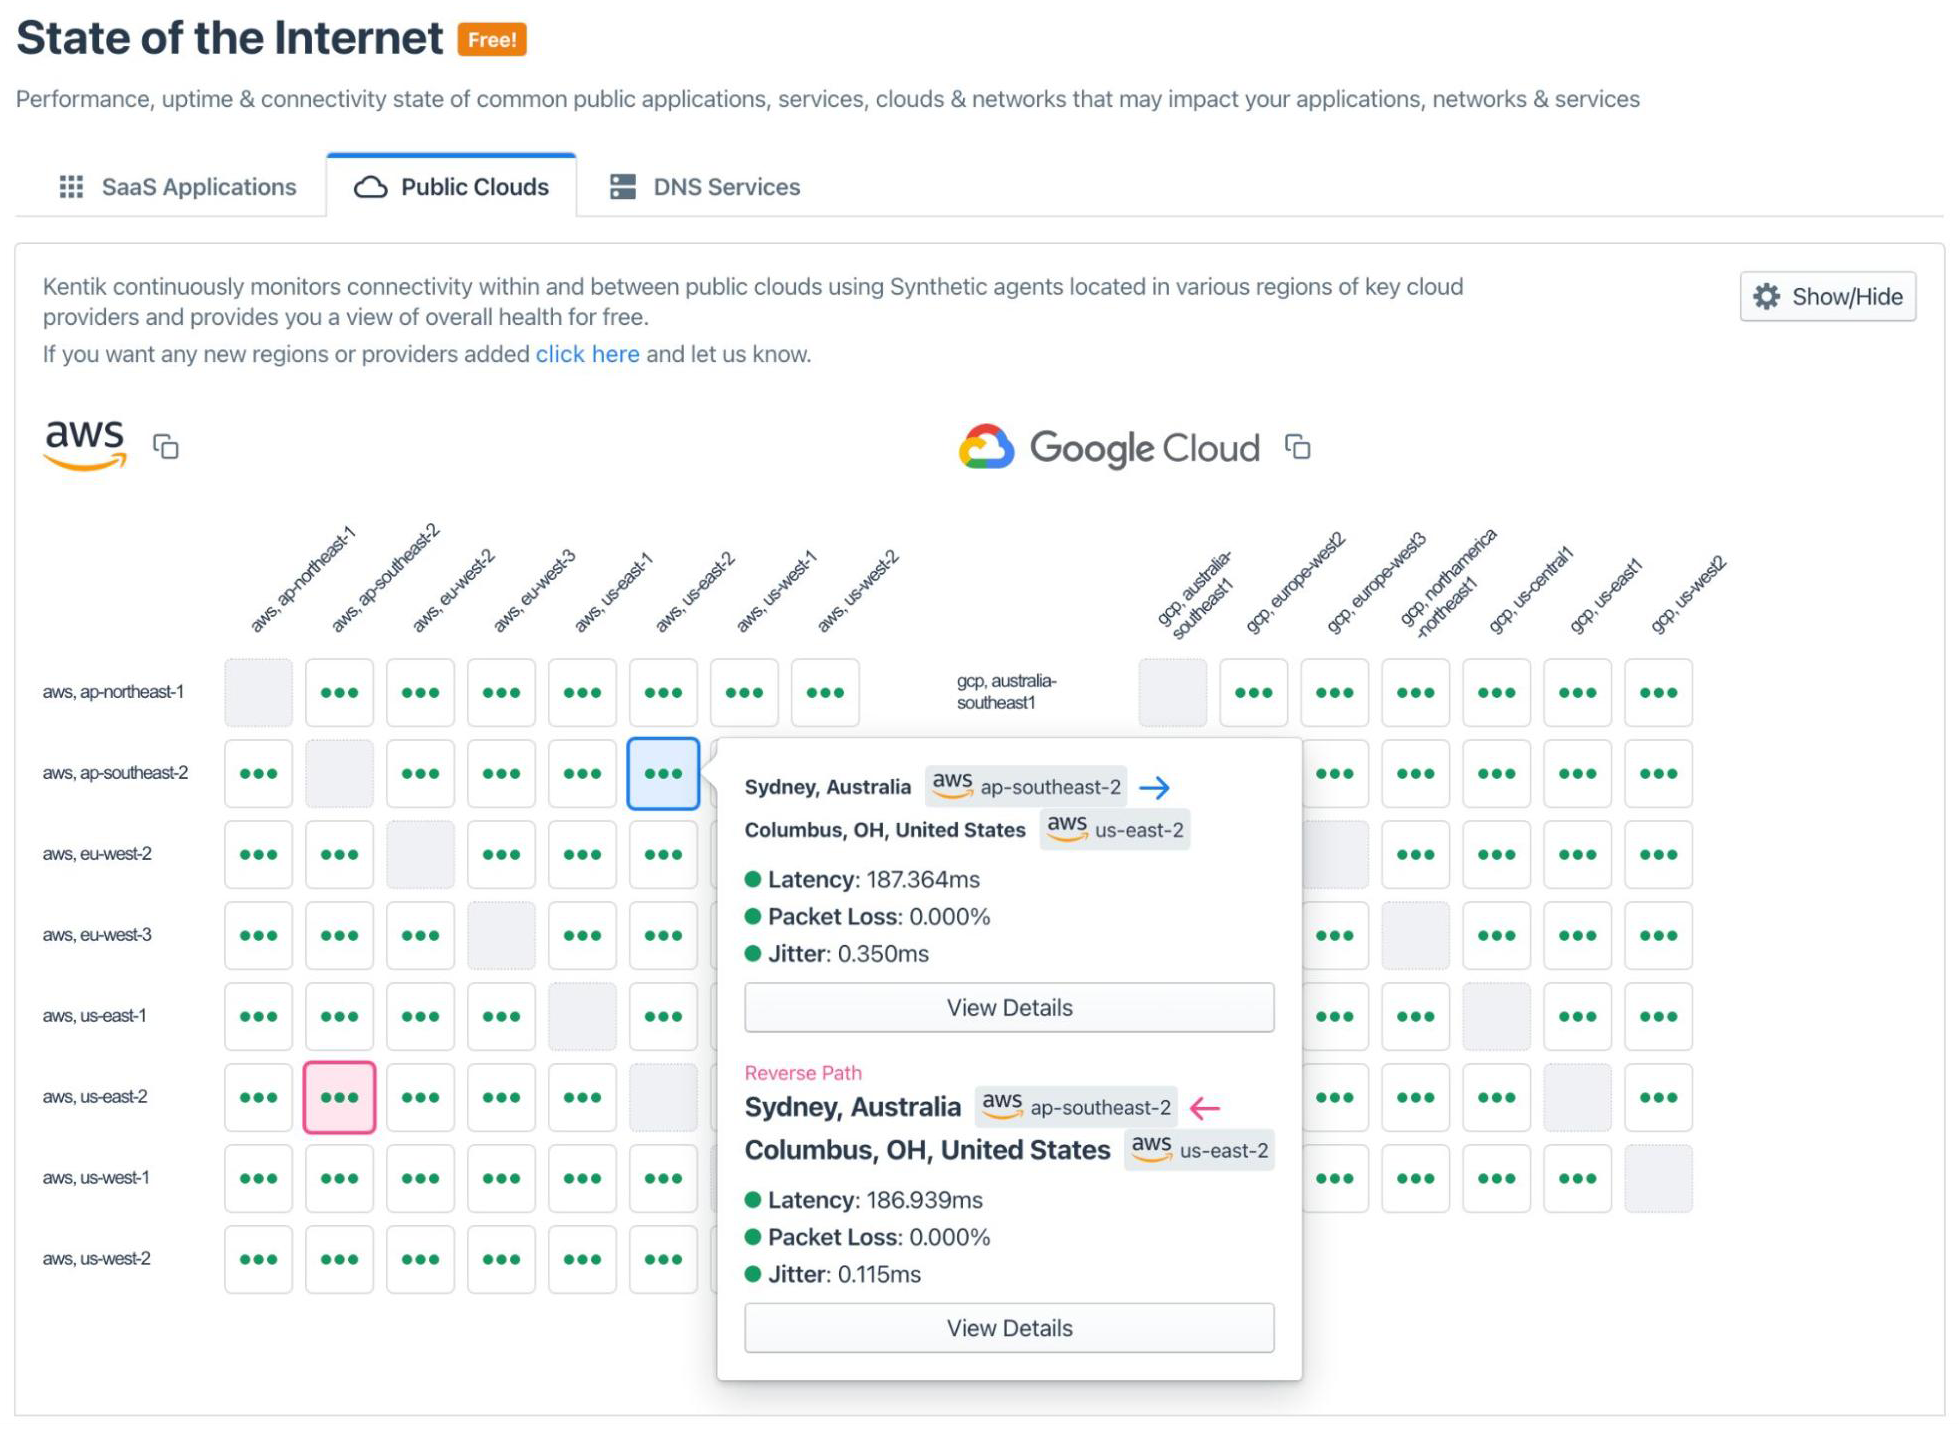
An example of synthetic testing is the Kentik “State of the Internet” for SaaS applications. Each test is performed by sending a GET request to the HTTP endpoint that the user (employee) would access for the specific application.

In addition, the test also performs a network layer (ICMP ping + traceroute) to the IP address resolved for the host that the HTTP server is running on or behind. If any part of that stack (network, DNS, or HTTP layer) slows down or fails, the test catches it immediately and can show you whether the failure was due to the network or at a higher layer. Synthetic testing isn’t just useful in the context of network connectivity and infrastructure. It can include BGP, DNS, CDN, and API services.
What is the difference between synthetic testing and real user monitoring?
Real user monitoring (RUM) aims to directly provide information on your application’s frontend performance from end users. Unlike active or synthetic monitoring, which attempts to gain internet performance insights by regularly testing synthetic interactions, RUM monitors how your users interact with sites or apps. Both synthetic testing and RUM can use agents or Javascript to generate measurements.
There are downsides to RUM. The first is the sheer amount of user analytics it can generate, making it difficult to identify and diagnose potential issues impacting end users. The second, which is more difficult to overcome, is that by its nature, RUM doesn’t enable you to test. If you want to see the quality of a connection to a particular region and there are no users online, you are out of luck. Or, if you are deploying a new app or public cloud resources, RUM won’t help you get a picture of the expected digital experience. RUM sheds light on the network path end users take beyond the web server so that it won’t generate data on WAN, SDWAN, and cloud-resource performance. Also, many SaaS applications your organization may utilize won’t allow agents to be embedded.
Monitoring cloud networking: Synthetics vs. flow
Synthetic network testing is only one of the key tools for monitoring and troubleshooting network performance. The other is flow monitoring, which lets you track and analyze the traffic generated by your actual users as they engage with your applications and environment. Flow monitoring uses various network flow protocols — such as NetFlow, sFlow, and IPFIX — or (in the case of cloud networking) VPC flow logs to collect and analyze data about actual IP traffic going to and from network interfaces and other devices.
Synthetic monitoring and flow monitoring provide total visibility into the network. Flow monitoring tells your team what is happening and what your users are experiencing in real-time. It alerts you when a service goes down, helps you track network egress costs, warns you when you are close to exhausting network capacity, and so on.
Meanwhile, synthetic testing provides insights into what will happen if conditions change. It’s a means of future-proofing your network as you add DNS servers, integrate new third-party services, or start supporting users based in a new region. It also offers a preview of what might result if a cloud provider has an outage or one of your data centers goes down.
In short, synthetic testing keeps you prepared for the future and ready to react, while flow monitoring ensures you catch issues that slip past your synthetic testing safeguards. Together, they enable network observability.
Kentik makes synthetic testing autonomous
With infrastructure, traffic, and path awareness, Kentik Synthetics can autonomously identify the most important places to test from to troubleshoot performance immediately after deployment.
Using path distribution information contained in flow, Kentik autonomously determines which path to use for synthetic tests so that test data best reflects actual paths. Kentik stays fully aware of traffic dynamics, allowing test configurations to adapt to network traffic and infrastructure changes.
With a single click, the Kentik can automatically provision different testing scenarios, including site-to-site, site-mesh, and hybrid infrastructure tests with combinations of ASNs, sites, countries, connectivity types, CDNs, and OTT providers.
Because they lack infrastructure and intelligence insights, point products and non-network solutions require users to engage in a manual and time-consuming process to configure tests—especially when infrastructure or traffic paths change.
Organizations are embracing cloud environments that are becoming increasingly complex. As a result, their ability to identify and troubleshoot problems in these resources is of increasing concern. Kentik is the industry’s first solution to close operational gaps introduced by cloud and hybrid cloud environments. The next article in this series, “Using Kentik Synthetics for your Cloud Monitoring Needs,” outlines how Kentik can close some of these operational gaps.


