Summary
Our network analytics platform supports visibility within public cloud environments via VPC Flow Logs. Our initial integration used VPC Flow Logs from Google Cloud Platform. Today, we are excited to extend our support to AWS. Read how we do it in this blog post.

It’s (becoming) a cloud-centric world.
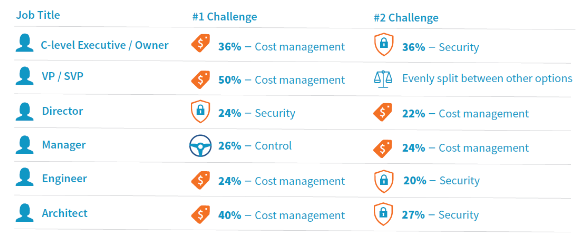
Workloads are moving from on-prem to one or more of the big clouds (namely AWS, GCP, Azure, IBM, and Oracle). If your organization has made the move, have you ever wondered whether you’ve actually achieved the performance, reliability and efficiency gains that the cloud promises, or if your data stays secure, or if your ops costs have actually decreased?
The answers can often be found with network visibility.
This summer, Kentik extended our analytics platform to support visibility within public cloud environments via VPC Flow Logs. Our initial integration used VPC Flow Logs from Google Cloud Platform as a data source and fully exposed GCP-specific tags like regions, zones, and VM names as dimensions within the Kentik UI (read our Solution Brief).
Today, we are excited to extend our support to AWS.
Review: Why VPC Flow Logs?
Cloud providers have taken away the burden of the traditional hardware layer most organizations are used to. On the one hand, this helps organizations reduce the related overhead of taking care of hardware. However, many cloud customers are then challenged by a lack of visibility into what is going on with their traffic patterns going into and out of their cloud network. With an increasing amount of requests from cloud adopters looking to monitor traffic in their VPC, Amazon, Google and Microsoft have all supported a Flow Logs feature. (You can read more about the three providers’ flow logs in our recent blog post “What Are VPC Flow Logs and How Can They Improve Your Cloud?”)
What’s in AWS VPC Flow Logs (and what’s unique)?
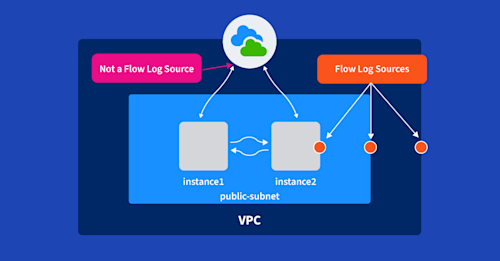
AWS VPC Flow Logs capture information about IP traffic flowing in and out of interfaces that are part of an AWS VPC. These flow logs can be used to analyze and troubleshoot issues within a cloud environment in a few key ways:
- They’re agentless. This makes integration much easier and cleaner. You can create and enable flow logs per ENI (Elastic Network Interface), per subnet or per VPC.

- They include security context. AWS Flow Logs contain a field indicating the forwarding status of the traffic. Dropped traffic can indicate misconfigurations or malicious activities, and is useful for both proactive detection of events, as well as real-time investigation.
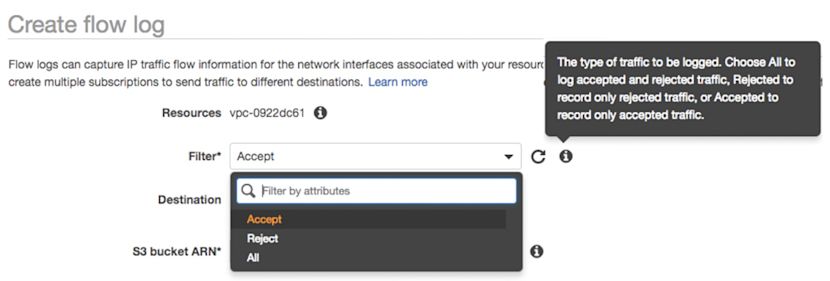
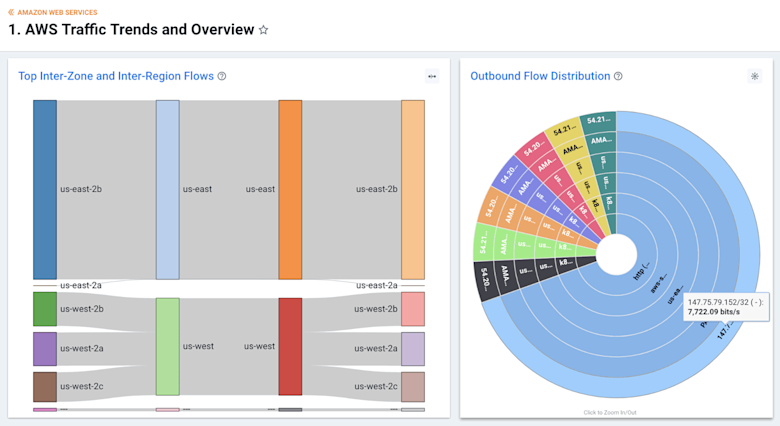
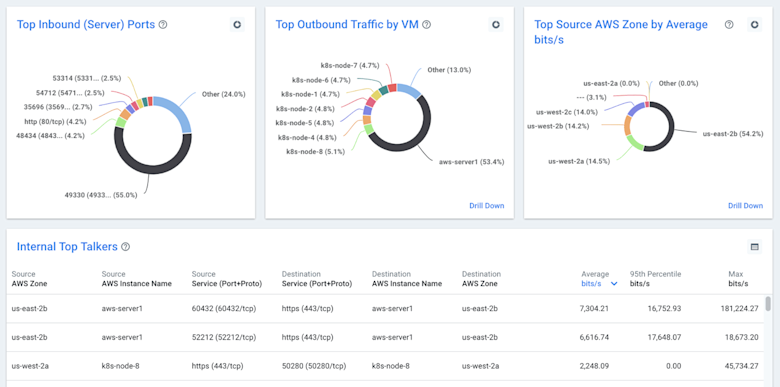
- They provide a new layer of context. Last but not least, AWS VPC Flow Logs can be matched with cloud metadata like VM names, regions, zones, and account IDs which adds deep context for questions like: What services are generating traffic? Which services am I using/not using? What are the dependencies among services? What services or instances are the top contributors to inter-zone traffic?
Below is a sample flow log record which contains
<version> <account-id> <interface-id> <srcaddr> <dstaddr> <srcport>
<dstport> <protocol> <packets> <bytes> <start> <end> <action> <log-status>

The following is an example of a flow log record in which SSH traffic (destination port 22, TCP protocol) to network interface eni-abc123de in account 123456789010 was allowed:
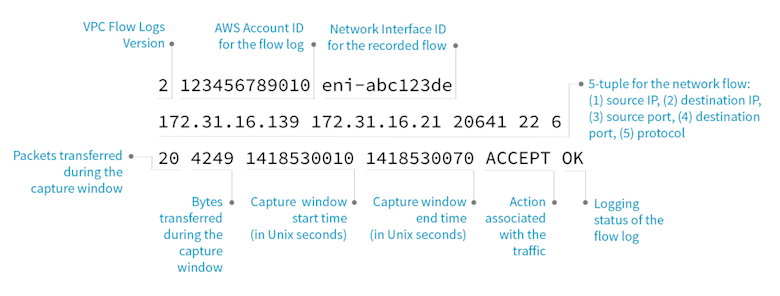
You can find more details, including the structure of each flow record and possible limitations in the AWS user guide.
What the “Kentik + AWS VPC Flow Logs” combination gives you
In a previous blog about GCP VPC Flow Logs, we talked about how Kentik can help multiple stakeholders within organizations to stop flying blind on their cloud initiatives, including:
- Management and Executives: For auditing cloud networking costs
- NetOps and NetEng: For comprehensive planning and trending
- SecOps: For detailed security analytics and forensics
These use cases and value hold strongly for us with AWS VPC Flow Logs, too. Additionally, with Kentik:
- You can monitor multiple accounts in the same cloud
- You can monitor both on-prem infrastructure and multi-cloud infrastructure
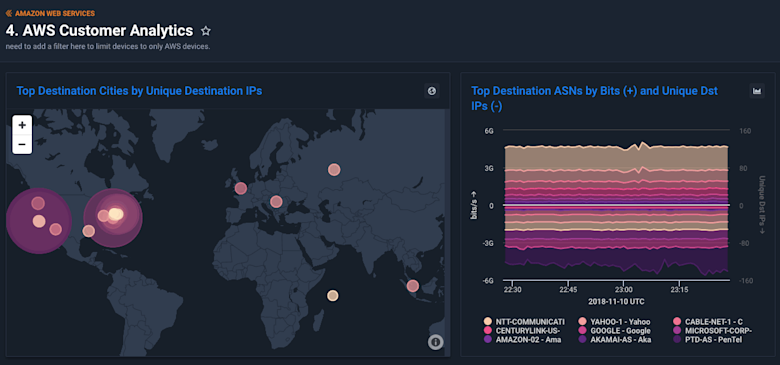
And you can do these all together under one unified view, enabling deep network visibility for greater business context to help deliver a greater customer experience and grow revenue.
Getting started with Kentik + AWS VPC Flow Logs
It’s straightforward to setup Kentik for AWS. To export VPC Flow Logs to the Kentik platform, just follow these four steps:
- Create an IAM Role, assign proper permissions and trust policy.
- Create an S3 Bucket.
- Enable Flow Logs on one or more VPCs and send them to the S3 Bucket.
- Configure Kentik to pull AWS Flow Logs.
For detailed instructions, see the Kentik for AWS article in the Kentik Knowledge Base. If you need a Kentik account, you can sign up for a free trial.
Also, visit us at AWS re:Invent Booth #112 to learn more about our cloud visibility offerings.

