How New Relic uses Kentik for network observability
Summary
With Kentik Synthetics, New Relic gains proactive insights about network performance and can ensure its customers have a reliable digital experience.
New Relic is known for empowering the world’s leading engineering teams to deliver great software performance and reliability. And the network that delivers that service to New Relic’s users plays a critical role. Hiccups in the performance of the network between New Relic’s mission-critical service and their users can create a cascade of problems.
New Relic uses their own service to manage performance. However, when it comes to the network, a solution that could monitor from the outside was needed. As Pedro Carvalho, a senior network engineer at New Relic, put so succinctly, “One of the big challenges we find in a hybrid environment is troubleshooting the network. It’s very hard to find and diagnose network connections unless you have a tool that can see things from the outside.”
With the move to public cloud infrastructure and the adoption of containerization, the challenge of monitoring and troubleshooting network performance has become incredibly complex. Detailed service level indicators (SLIs) and service level objectives (SLOs) aren’t useful if you don’t have the insights you need to address problems. This is where Kentik excels, giving you one platform to view real traffic monitoring alongside synthetically generated tests.
Are your providers meeting their SLAs?
Troubleshooting network issues in a hybrid environment is a challenge that New Relic does not face alone. The network outside and the cloud services required are in the hands of third-party providers (cloud SAAS, cloud IAAS, dedicated telecom, contracted telecom, etc.). Holding your cloud and network providers accountable is only possible if you have detailed data about how they are performing and how they will perform given certain conditions.
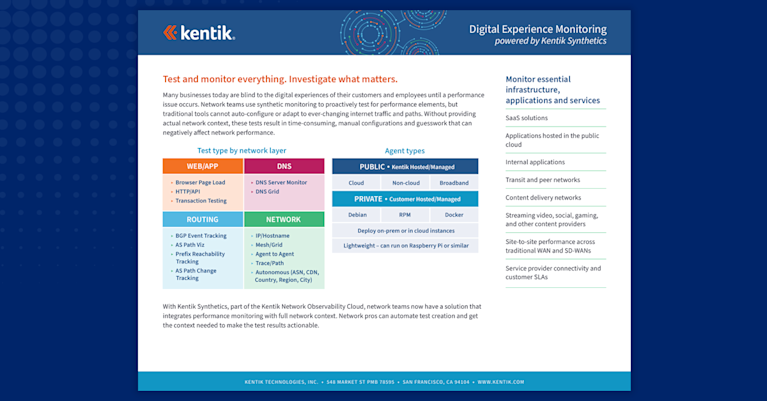
That’s where Kentik Synthetics can help. By using our global public agents and private agents deployed on your infrastructure, we can give you an intimate understanding of the network conditions your users/customers are experiencing — even if you do have an outage. Kentik can provide synthetic test results and related traffic flow information side-by-side, giving you a detailed understanding of the experience users are actually having and what experience they will have if conditions change.
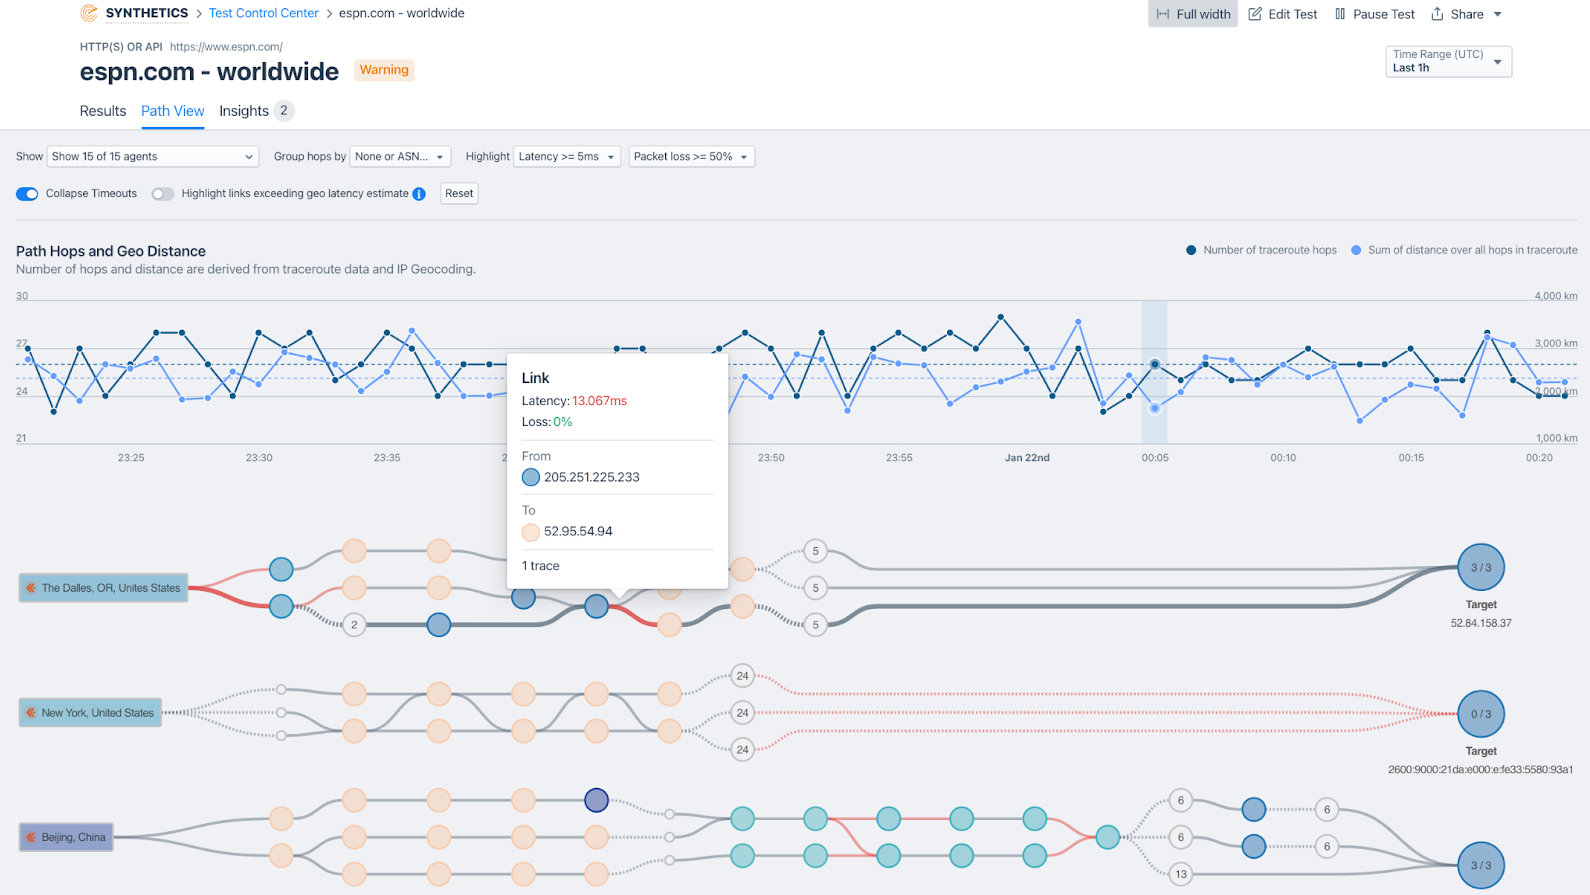
Keeping vendors accountable is also an area where we are helping New Relic. April Carter, the senior software engineering manager at New Relic says “Kentik gives us the ability to diagnose issues, and if it’s vendor-related, we can instantly tell that vendor exactly what links are affected and when.”
Cloud Performance Monitoring
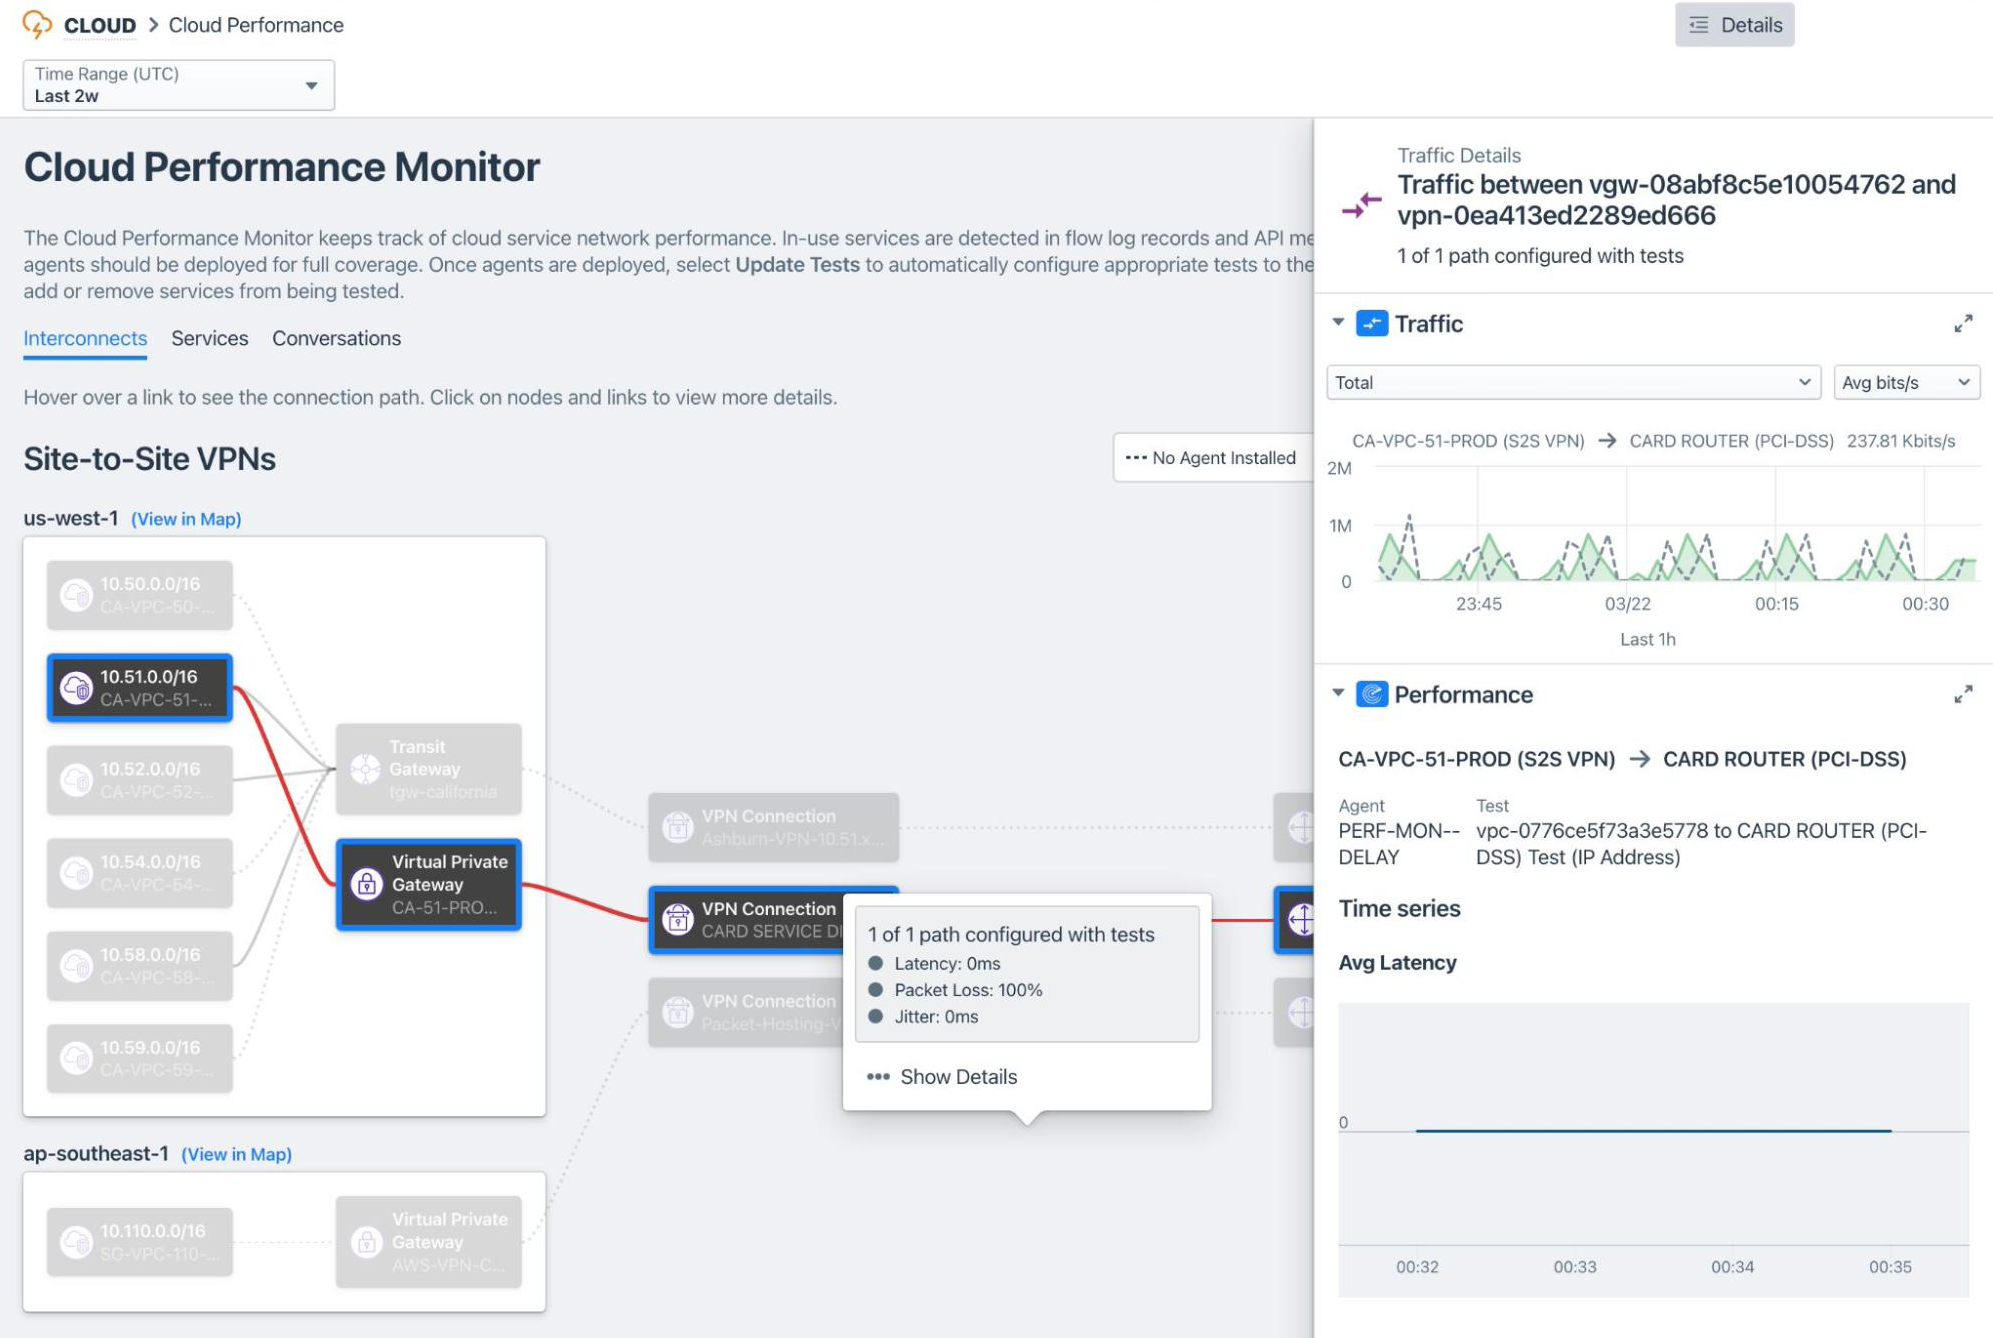
Our performance monitor can give you the ability to diagnose interconnection performance problems impacting traffic between your cloud and on-prem networks. It will auto-discover VPN/DCG interconnections and give you latency, jitter and packet loss statistics between and within VPCs.
Facilitate DevOps collaboration
One of the features of the Kentik service the New Relic found especially useful is Kentik Firehose. Kentik Firehose uses a binary, called KTranslate, also available as an open source project, to listen to HTTP(s) traffic from the Kentik platform and perform the desired transformations to deliver the data in the format that the customer’s system can ingest. New Relic is then able to integrate this data into interfaces that their internal users are familiar with.

This integration enables network and DevOps teams to collaborate detecting and geo-locating network threats affecting their applications and to understand the role of cloud infrastructure on application performance. New Relic and their users are able to troubleshoot application performance degradations in an expedited manner — critical in complex network environments such as distributed services in cloud deployments.
New Relic Case Study Now Available
Kentik is proud to partner with New Relic, both by providing them with our network observability solution and as a technology partner. There’s no greater example of how the network can be made observable within the industry’s leading observability solution. And for Kentik and New Relic, that’s proven at both the engineering level and the solution-level for our joint customers.
To learn more about how New Relic uses Kentik, read the complete case study. Want to learn more about Kentik? Start a 30-day trial and give Kentik Synthetics a try.


