How to Escape Legacy Monitoring (and Thrive in the Era of AI Networks)


Summary
It’s no exaggeration to say the network has transformed dramatically: Hybrid cloud architectures and AI-powered infrastructure seem to expand in scale and complexity every day. But legacy tools to monitor and observe these networks have not kept up. Let’s directly compare the fragmented world of legacy network monitoring with network intelligence, and an all-in-one SaaS platform that unifies metrics, flow, cloud, and AI.
For years, many network teams have relied on tools that feel … familiar. Perhaps too familiar. If you’ve been in the trenches with solutions like SolarWinds NPM (Network Performance Monitor) or NTA (NetFlow Traffic Analyzer), you know the routine: separate modules, disparate experiences, manual context-switching, and that nagging feeling that your tools aren’t quite keeping pace with your evolving network.
Modern networks demand a modern approach. The days of treating flow and metrics as separate entities, struggling with limited cloud visibility, and investing resources in on-premises upkeep are behind us. The network has changed dramatically… shouldn’t the way you monitor and get network insights evolve, too? (You can learn how Kentik compares vs SolarWinds here. And check out our article here for a deeper discussion of SolarWinds alternatives.)
Let’s explore a network monitoring strategy built to support rapid AI infrastructure growth and usage, as well as the complexity of today’s hybrid networks.
The challenge of disparate tools in a unified world
One of the biggest frustrations with legacy network monitoring systems is the fragmented experience. Most legacy platforms are, in practice, just individual tool modules integrated with each other and a shared web portal. Correlating flow and metrics data often means jumping between views, re-querying, and manually stitching together insights. This creates a mental overhead, forcing you to constantly switch context just to piece together a complete picture of an issue. It also creates operational overhead when trying to maintain the network, and a nightmare when trying to scale. Anyone got a spare server lying around?
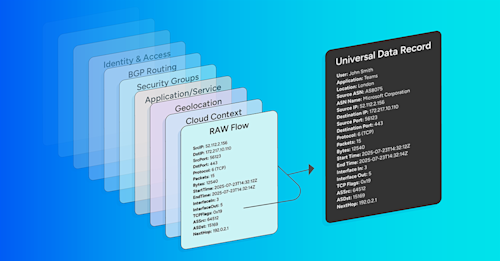
Imagine a world where all the data needed to design, operate, and protect your networks – flow, SNMP, traps, syslog, cloud logs, synthetics, and more – lives in a single, unified platform with a consistent, highly enriched, scalable data model. This isn’t a pipe dream. It’s the foundation of modern network intelligence. A unified approach eliminates manual data merging and accelerates investigations, enabling you to transition from insight to action with greater efficiency and productivity. It makes it easy to see when a device is at 95% CPU, which app is driving the traffic, which app it belongs to, and where it’s going.
Navigating the cloud: Visibility gaps are no longer acceptable
Many legacy solutions offer, at best, limited visibility into select cloud gateways. This leaves gaping blind spots in your AWS, Azure, GCP, or OCI environments, making it nearly impossible to understand cloud paths or implement effective SaaS synthetics.
Modern network intelligence provides native, deep visibility into public cloud environments. This involves understanding traffic patterns within your VPCs, VNets, and VCNs, eliminating unnecessary costs in your cloud network architecture, and ensuring consistent service delivery, regardless of where your infrastructure is located.
Flow data: From basic dashboards to actionable insights
Flow data has been around for a long time, but aging tools often struggle to unlock its full potential. In fact, this is something we hear from customers all the time – they have a flow solution but don’t use it or see much value in it. That’s an issue with the tool. Not the data.
Legacy NetFlow tools often limit you to simple analysis and dashboards, and quickly buckle at large scale. They were made for reporting and basic planning.
These legacy NetFlow tools were built for reporting, not designing. Limited development means you’re often stuck with basic top talker reports, lacking crucial visualizations like Sankey diagrams that reveal complex traffic patterns. Performance issues at scale are also a common complaint, especially with unsampled data.
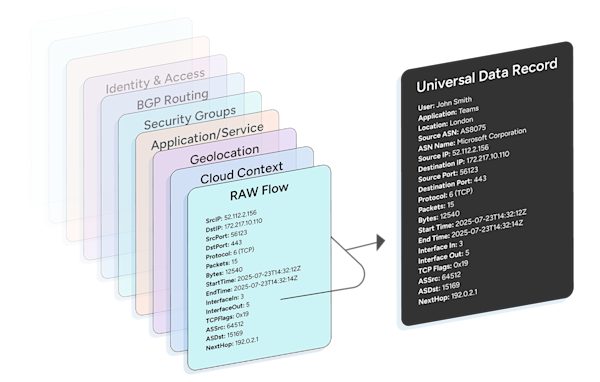
Modern network intelligence platforms like Kentik change that equation. Instead of treating flow as a standalone dataset, Kentik enriches it at ingest with real-time context from across your environment — BGP, SNMP, cloud APIs, DNS, GeoIP, Kubernetes, and more. The result is flow data that’s human-readable, intuitive, and immediately useful across teams.
With that context in place, visualizations like multi-stage Sankey diagrams become more than just eye candy — they become a way to see how applications, users, and infrastructure interact across the network. You can follow traffic from origin to destination, layered with business, cloud, and routing metadata, revealing dependencies and inefficiencies that were invisible before.
When you can see not just who’s talking to whom, but also what, where, and why, flow becomes a daily driver for cost management, performance optimization, and security assurance. Operators can instantly understand the impact of an application rollout on link utilization, isolate which tenant or VPC is driving unexpected costs, or identify anomalous traffic between regions.
This contextual depth transforms flow from static dashboards into actionable intelligence — the foundation for AI-powered insights that help predict issues, optimize capacity, and ensure reliable service delivery.
Beyond traditional network monitoring metrics
While SNMP, SNMP traps, and Syslog are still vital, they represent only part of the telemetry story. Legacy systems often rely solely on these traditional collections, struggling under higher polling rates and requiring significant horizontal resource build-out to scale. This leads to increased costs and complexity.
A modern metrics approach must also support streaming telemetry, like gNMI. This “push” model is fundamentally more efficient than polling and provides the high-fidelity, real-time data needed to see transient network issues. This is the only way to catch critical problems like microbursts, ECMP imbalances, or buffer issues that are completely invisible to 5-minute polls.
Because the Kentik platform was built as a SaaS solution, it was designed to ingest and analyze these high-frequency data streams at scale without performance degradation. This gives you the real-time, granular insights you need, without forcing you to provision, manage, or scale another set of polling engines.
AI and machine learning: The new frontier of network operations
In today’s complex networks, manual investigations often serve as a bottleneck. Many traditional tools either lack AI capabilities or have limited ones, leaving engineers to sift through mountains of data to find root causes.
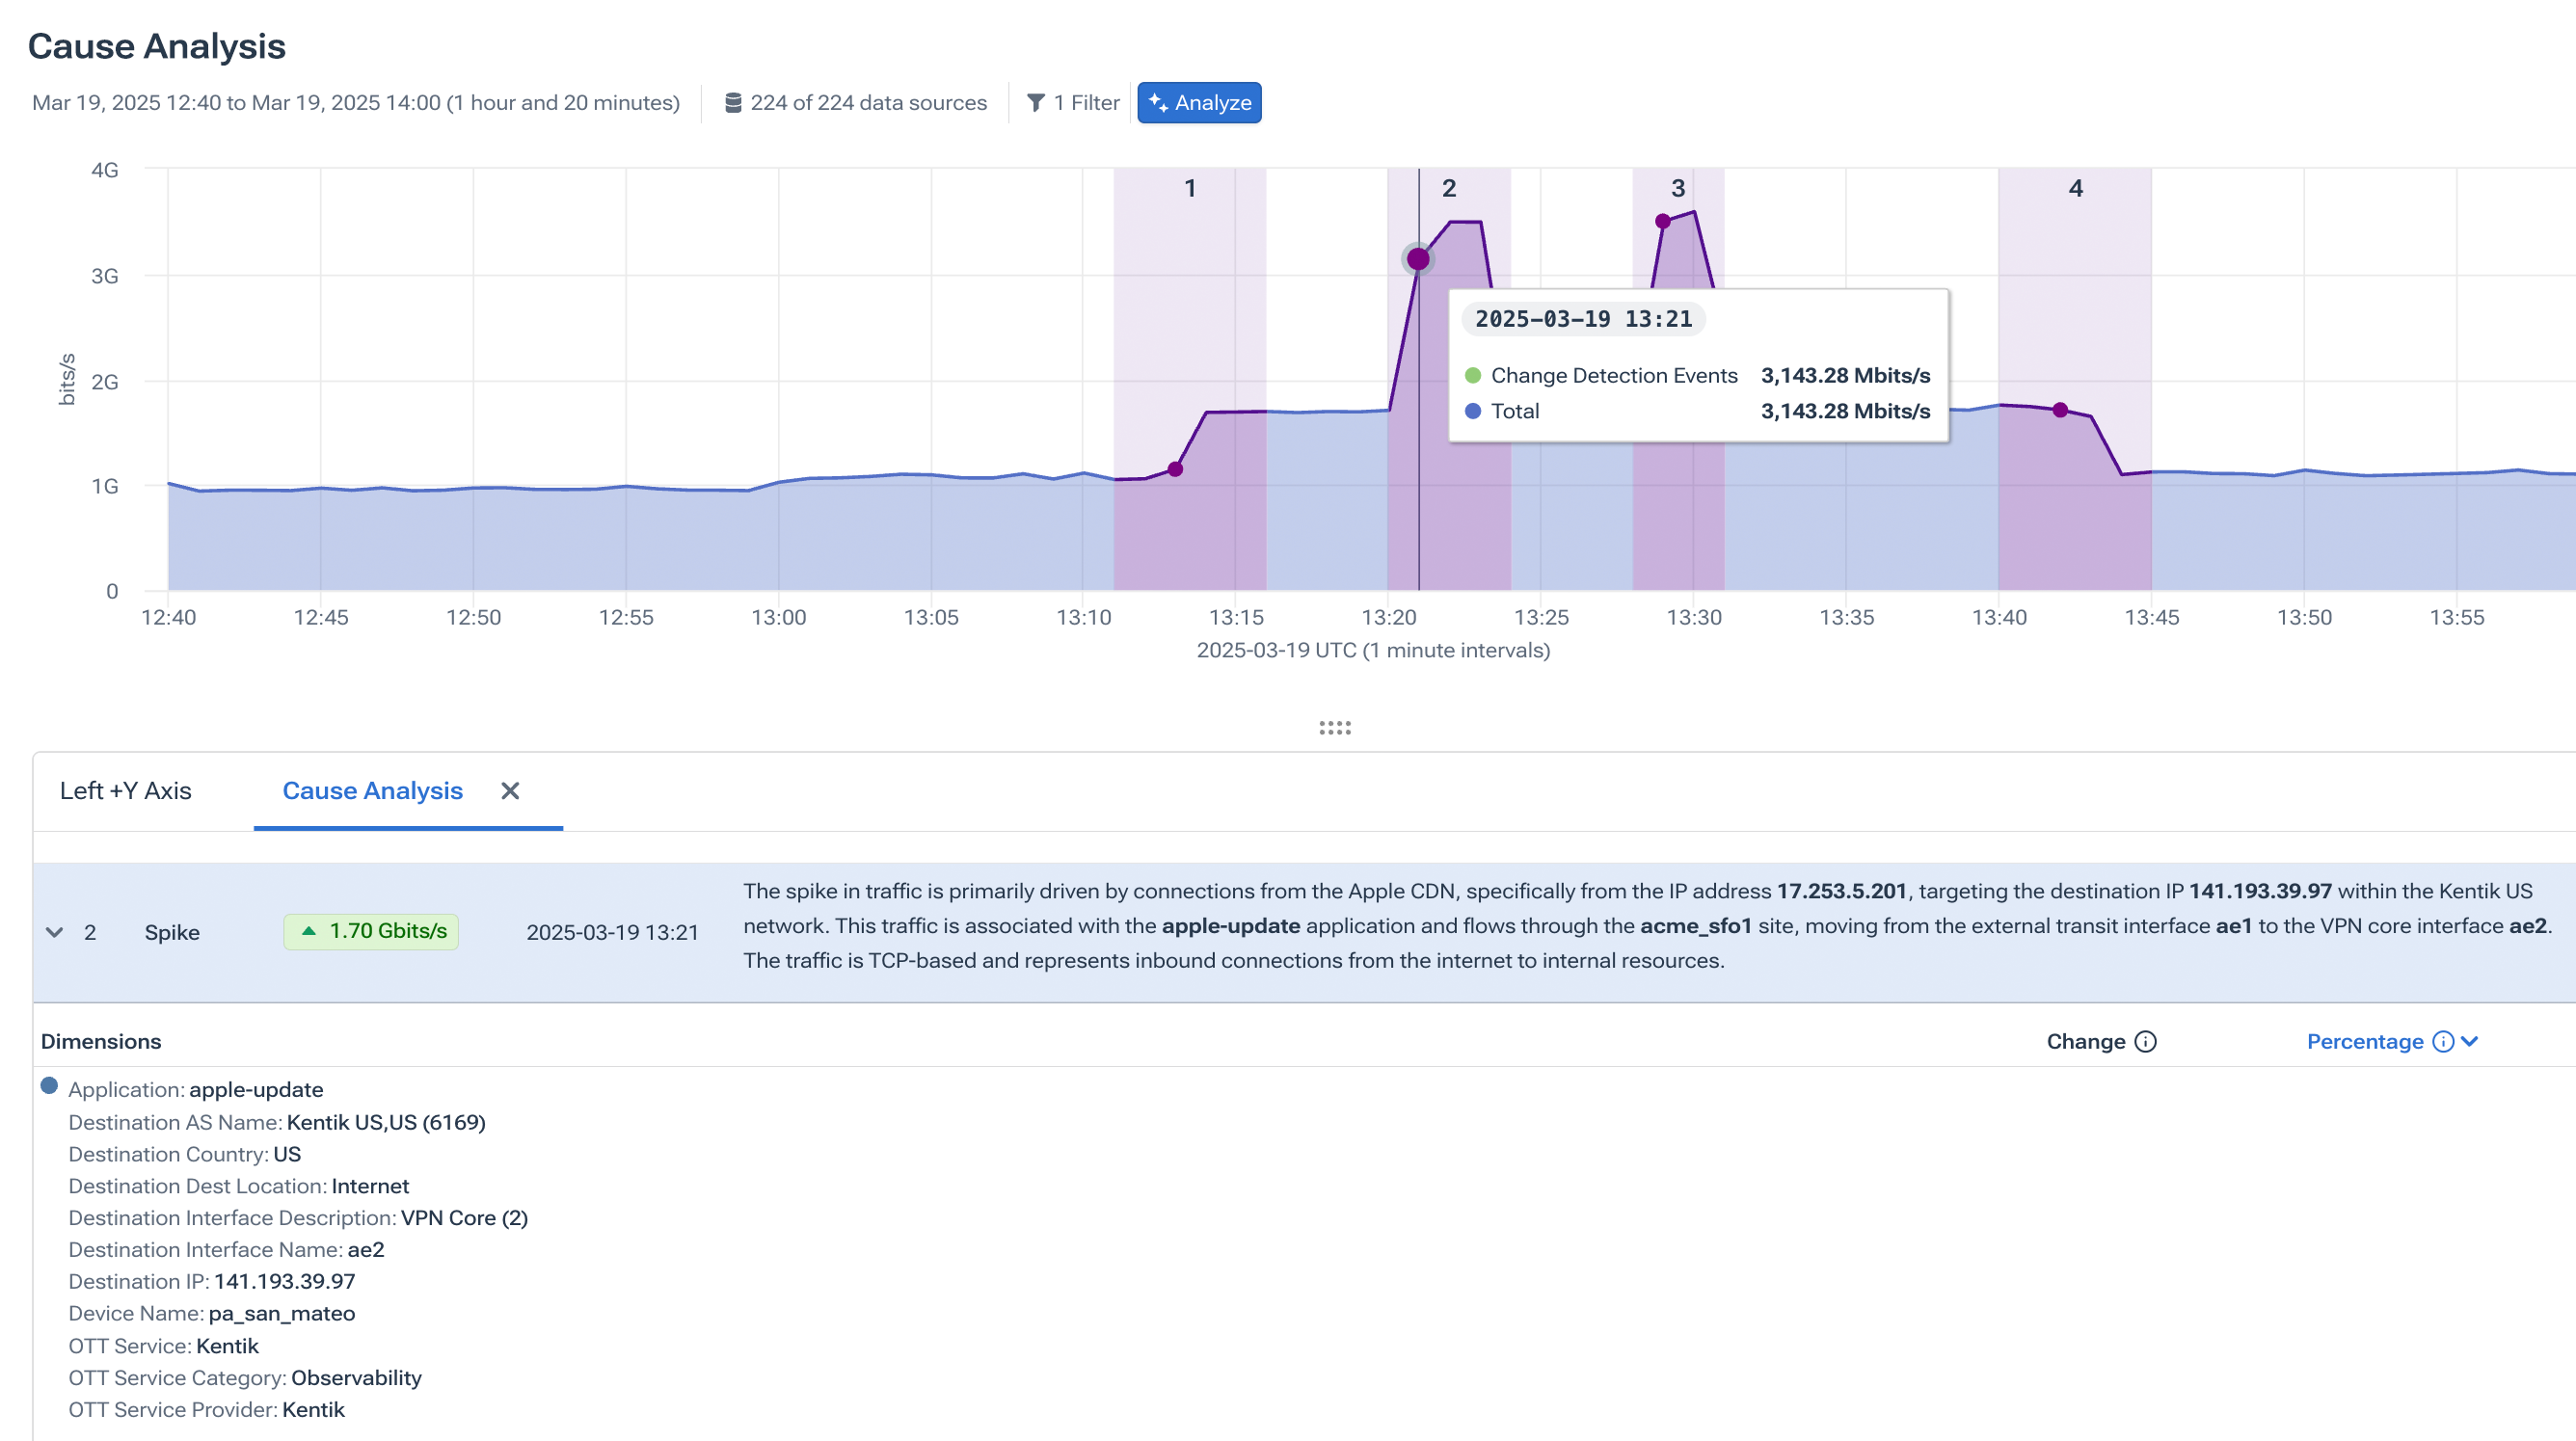
A core failure of legacy monitoring is that it’s adept at flagging symptoms but offers almost no help with the cause. These platforms may tell you when a service is down or that traffic has spiked, but they abandon your engineers at the most critical step: finding out why. Answering this traditionally requires senior-level intuition and tedious, manual investigations across massive datasets, a time-consuming process when every second of downtime counts.
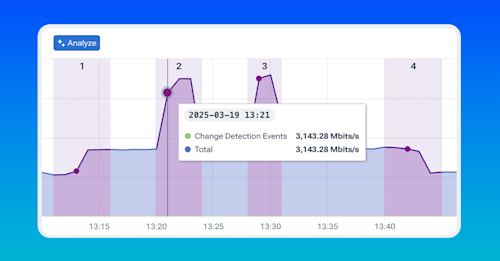
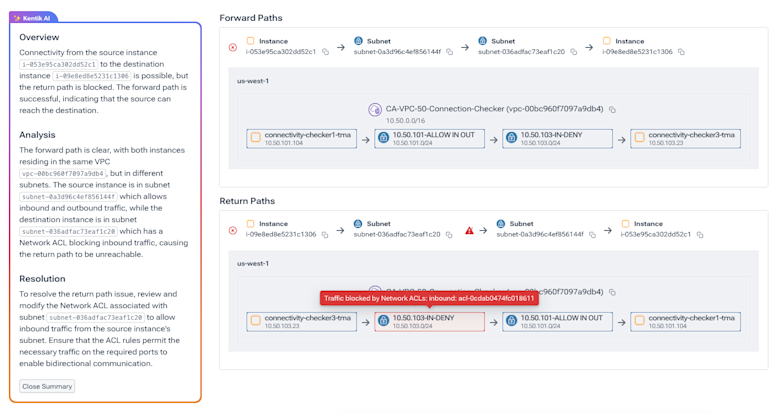
The Kentik platform embeds AI to automate this entire investigative process. Kentik Journeys, for example, transforms this workflow by empowering engineers to use natural language to investigate issues and systematically ask follow-up questions. Complementing this, Cause Analysis automatically identifies the most likely drivers of any traffic change in just a few clicks. This combination drastically accelerates MTTR, democratizes network intelligence for the entire team, and turns overwhelming data into clear, actionable answers—allowing senior experts and junior operators alike to quickly diagnose and resolve complex network problems.
Cost and capacity planning: Insights that impact the bottom line
Understanding traffic trends is good, but linking them directly to your budget is better. Legacy monitoring platforms might show you traffic volume, but they leave you blind to the actual cost of that traffic, forcing teams to make critical financial decisions based on guesswork. This manual, spreadsheet-driven approach—relying on report exports and data merging from separate modules—is a tedious, error-prone exercise. It means you risk eroding margins on unprofitable customer renewals or overspending on inefficient transit routes.
The Kentik platform, by contrast, provides powerful, integrated capacity and cost insights. With its integrated Traffic Costs workflow, Kentik is the industry’s first solution to combine detailed traffic trends with your actual cost data, connecting every traffic slice to its precise financial impact. In just a few clicks, you can instantly see the exact cost to serve any customer, region, or application. This turns cost analysis from a manual nightmare into an automated tool for making smarter routing decisions, optimizing peering agreements, and ultimately boosting your profitability.
Overhead: The hidden cost of legacy network monitoring tools
The operational and financial overhead of legacy, on-premises monitoring tools is a silent drain on resources. Maintaining multiple servers, polling engines, and databases – each with its own licenses, updates, and maintenance cycles – consumes valuable capital and even more valuable time. Then there’s the financial unpredictability: modular licenses, maintenance fees, and hardware expansions that quietly inflate your cost of owning and running the solution.
Modern, fully SaaS platforms like Kentik eliminate that burden entirely. No servers to patch, no surprise hardware costs, no complex or additional licensing requirements. Just transparent, predictable pricing and seamless scalability. This eliminates hidden hardware costs and provides predictable spending, allowing you to budget confidently and demonstrate clear ROI.
The networks of today demand more than just monitoring. Kentik unifies flow, infrastructure performance, device status and metrics, cloud traffic, synthetics, and AI-powered insights – so you can plan capacity, troubleshoot faster, improve network security, and prevent incidents before they happen. The Kentik Network Intelligence Platform is a modern, cloud-native solution, meaning no servers to maintain, no tool sprawl, and fully transparent pricing.
Give Kentik a try today.
