Kentik Kube extends network observability to Kubernetes deployments

Summary
We’re excited to announce our beta launch of Kentik Kube, an industry-first solution that reveals how K8s traffic routes through an organization’s data center, cloud, and the internet.
We’re excited to announce our beta launch of Kentik Kube, an industry-first solution that reveals how K8s traffic routes through an organization’s data center, cloud, and the internet.
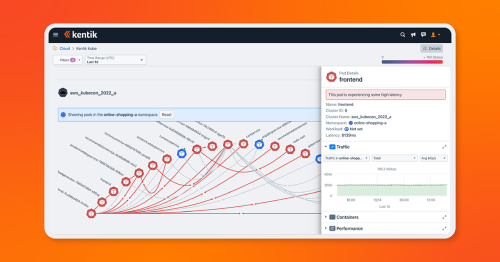
With this launch, Kentik can observe the entire network — on prem, in the cloud, on physical hardware or virtual machines, and anywhere in between. Kentik Kube enables network, infrastructure, platform, and DevOps engineers to gain full visibility of network traffic within the context of their Kubernetes deployments — so they can quickly detect and solve network problems, and surface traffic flowing from pods to external services.

Why we built Kentik Kube
Very often, pods and services experience network delays that degrade a user’s experience. Up until now there has not been a means to identify which Kubernetes services and pods are experiencing network delays. The complexity of microservices leaves developers wondering if the network reality matches their design, who are the top requesters consuming Kubernetes services or which microservices are oversubscribed, and how the infrastructure is communicating both within itself or across the internet.
Kubernetes has become the de facto standard for cloud-based applications. As companies migrate their workloads, ensuring the reliability, connectivity and performance from user applications and their clusters, to the entire infrastructure and internet is critical.
Kentik Kube use cases
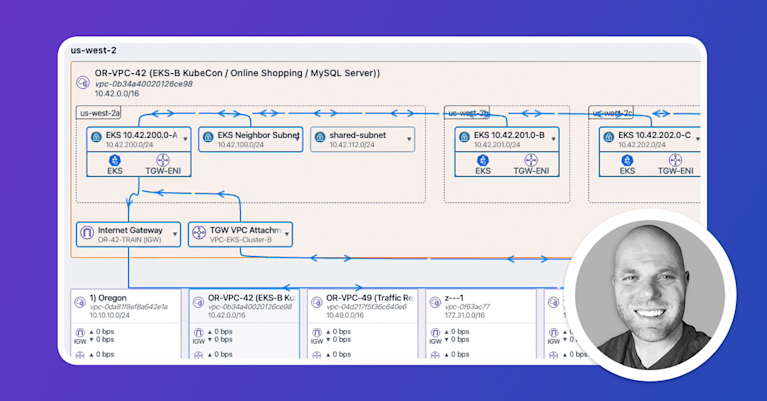
We built Kentik Kube to provide visibility for cloud-managed Kubernetes clusters (AKS, EKS, and GKE) as well as on-prem, self-managed clusters using the most widely implemented network models. Teams responsible for complex networks can:
Improve network performance
- Discover which services and pods are experiencing network latency
- Identify service misconfigurations without capturing packets
- Configure alert policies to proactively find high latency impacting nodes, pods, workloads or services.
Gain end-to-end K8s visibility
- Identify all clients and requesters consuming your Kubernetes services
- Know exactly who was talking to which pod, and when.
Validate policies and security measures
- See which pods, namespaces, and services are speaking with each other to ensure configured policy is working as expected.
- Identify pods and services that are communicating with non-Kubernetes infrastructure or the internet — when they should not be.
How Kentik Kube works
Kentik Kube relies on data generated from a lightweight eBPF agent that is installed onto your Kubernetes cluster. It sends data back to the Kentik SaaS platform, allowing you to query, graph and alert on conditions in your data. This data coupled with our analytics engine, enables users to gain complete visibility and context for traffic performance inside and among Kubernetes clusters.
Mapping your network with Kentik Kube
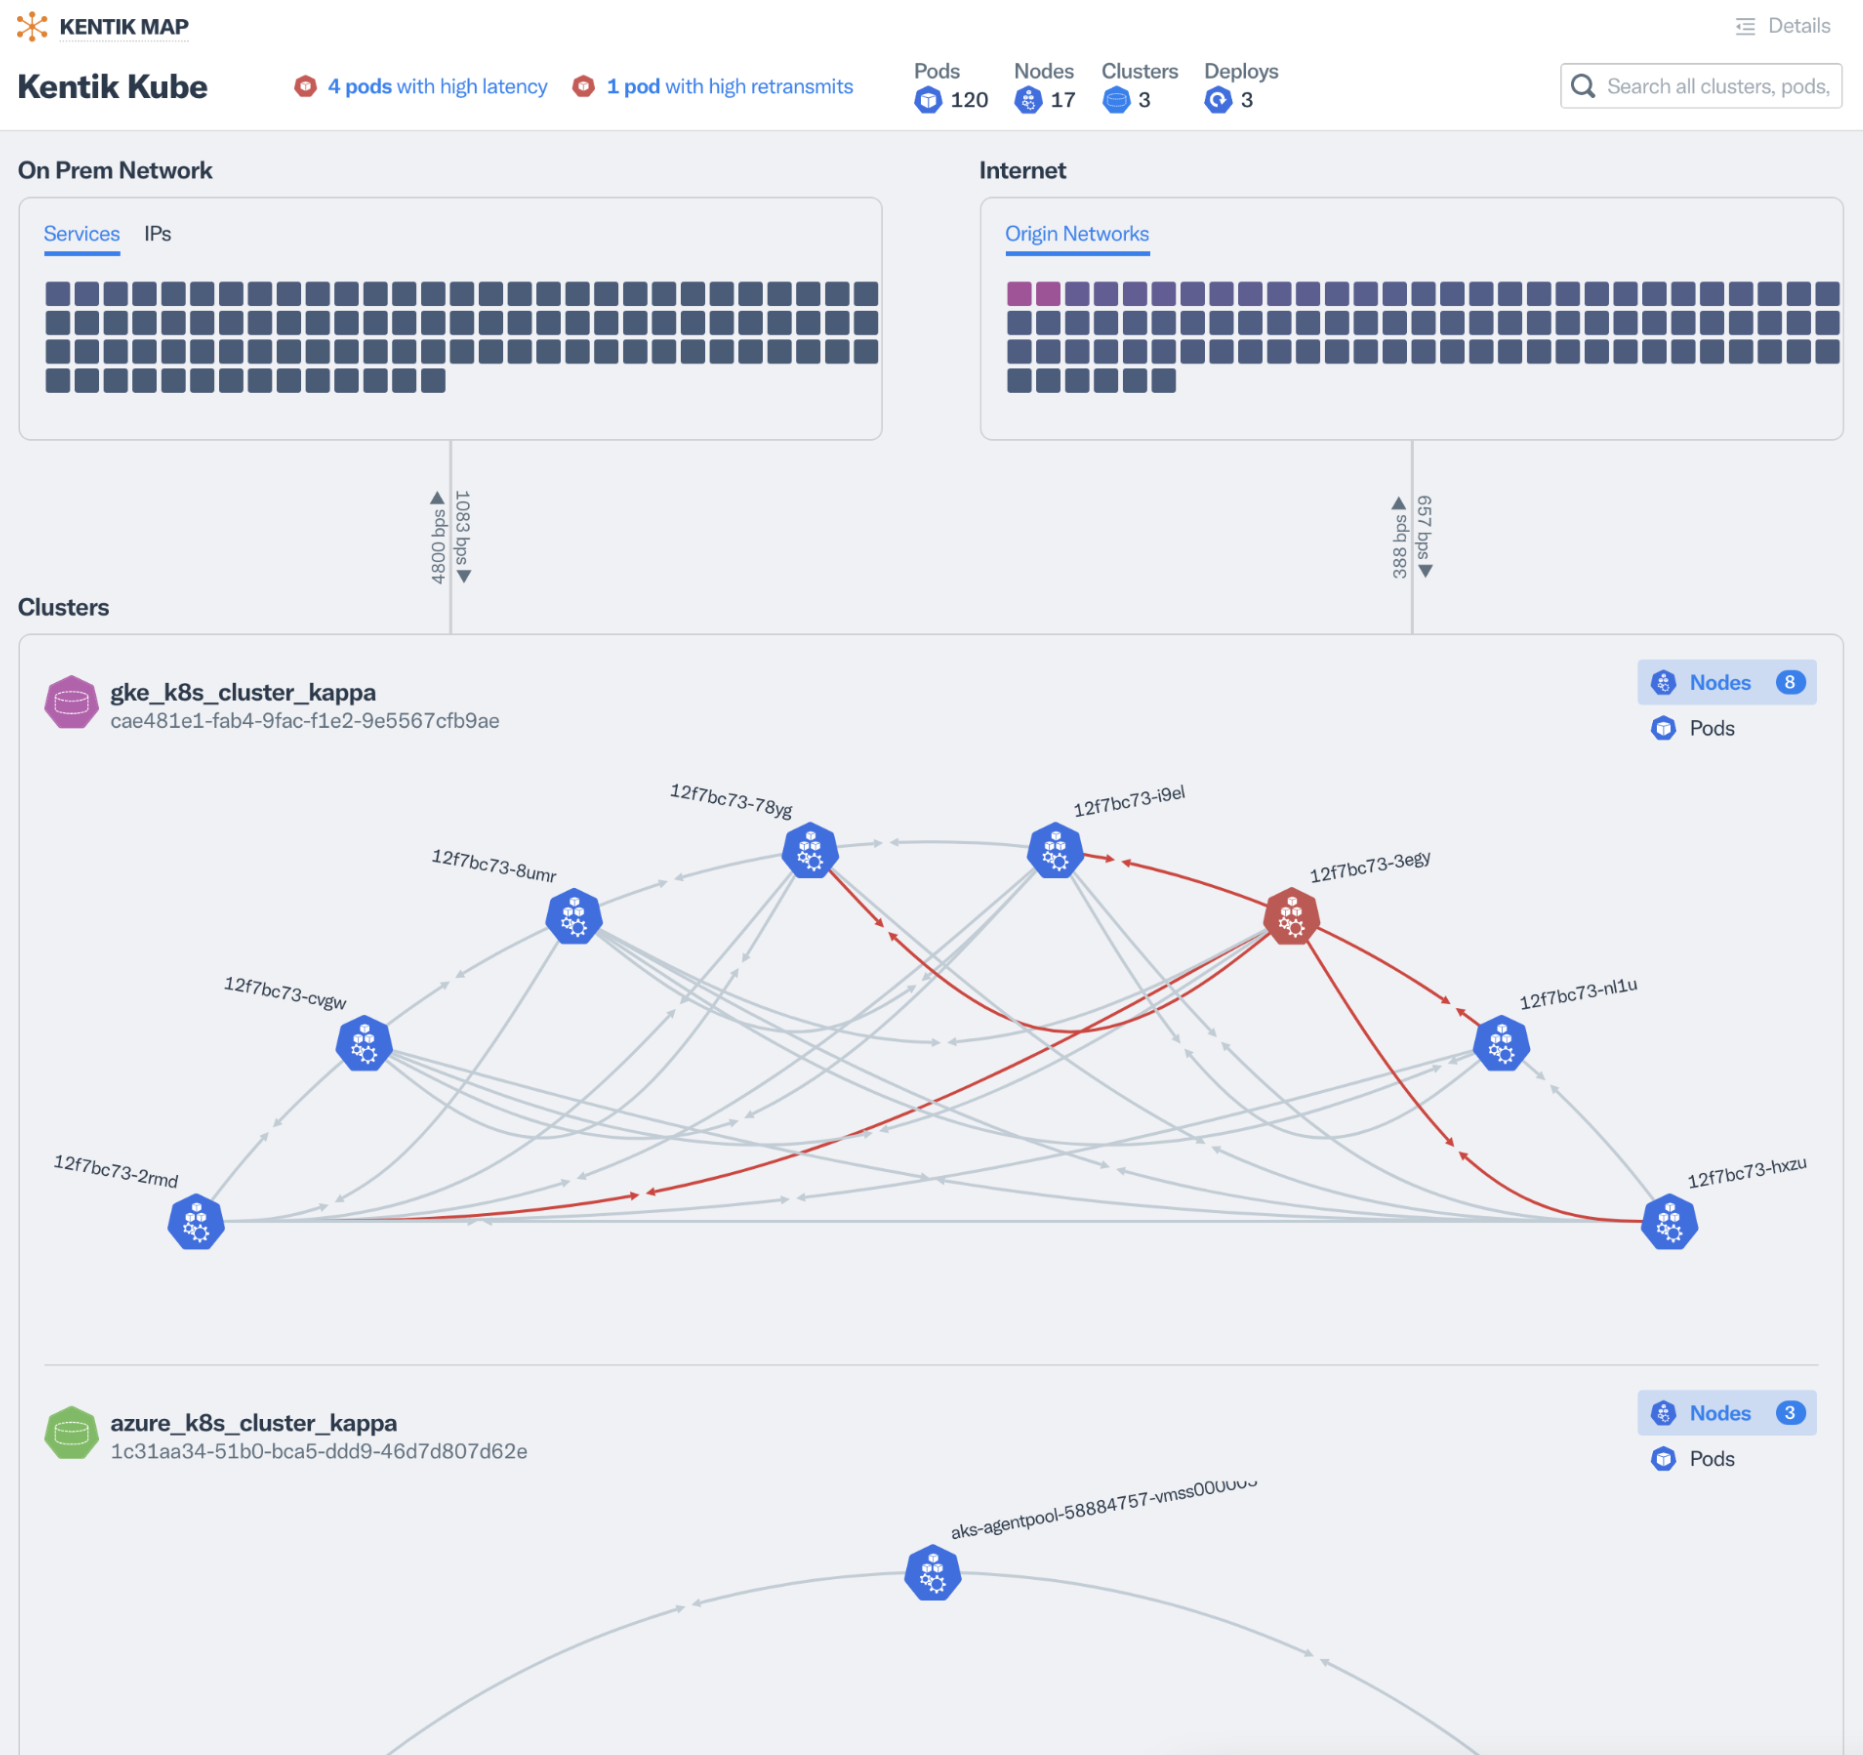
Kentik Kube provides east-west and north-south traffic analytics inside and among Kubernetes clusters. Kentik will automatically detail your network map once you have deployed the eBPF agent.

Kentik Kube can display details so you can see if your route tables, NACLs, etc. are all configured correctly. You can drill down into a cluster to see if there are latency or other issues. Our eBPF telemetry agent deployed into these clusters lets you see the traffic between the nodes and the latency.

How to get started with Kentik Kube
Kentik Kube is now in beta. You can apply to trial the beta here. Please share your feedback with us. We’d love to hear what you think.


