Kentik’s Journey to Deliver the First Cloud Network Observability Product

Summary
With today’s launch of Kentik Cloud, we’re making it easy for network and cloud engineers to visualize, troubleshoot, secure and optimize cloud networks. In this post, we share more about Kentik Cloud and why we thought it was important for us to build it.
Why 1,000 different cloud monitoring solutions don’t help network engineers
Today, we are excited to announce the launch of Kentik Cloud, our latest innovation enabling network and cloud engineers to easily visualize, troubleshoot, secure, and optimize cloud networks. We are super excited to tell you about all the things that make Kentik Cloud special (and there are a lot!), but first, we thought it’d be good to tell you why we thought it was important for us to build Kentik Cloud and share a bit of the journey that we took to build it.
Cloud Questions
We’d been hearing for some time that managing cloud networks had become a real pain. Many of our customers already running large on-prem networks noted a trend: As their companies settled into the cloud, network teams were asked to step up to help configure network architectures, establish connectivity to their data and remote offices, and solve connectivity issues for the app teams. But, when they peeled the covers back to gaze at their newly inherited clouds, what they found was not pretty: dozens of ingress and egress points with no security policies. Internal communications routed over internet gateways and driving up costs. Abandoned gateways and subnets configured with overlapping IP space. A Gordian knot of VPC peering connections with asymmetric routing policies. In short, these cloud networks weren’t being managed by network engineers. One of our partners put it this way:
— Network Engineer at a Fortune 500 Company
But a lot of these teams couldn’t just roll up their sleeves and start fixing things. Many network engineers are still getting their feet wet when it comes to cloud networking. Some aren’t fluent with cloud terminology or haven’t been exposed to cloud consoles and APIs. Cloud networking concepts feel familiar but are just different enough to cause confusion. And the cloud vendors’ management interfaces don’t make it easy to do simple things like figuring out traffic paths or visualizing traffic going over a VPN.
In short, running cloud networks is slowing network teams down. This is happening at the same time that SRE and DevOps teams are actually speeding up and enjoying the agility of the cloud. The problems lurking inside the cloud network are demotivating teams — and making them wonder if others are noticing. They worry that others might think that network teams were purposely moving slow.
When we heard all this, we were puzzled: Weren’t cloud networks supposed to be easy? After all, we knew tons of folks — many of whom know nothing about networks — happily running little cloud environments without trouble. And it’s not like the network teams had to worry about fixing failed line cards or erroring ports. Also, we wondered, wasn’t there already a well-developed market of tooling to help here? So we asked hundreds of questions to try and understand what was going on. And what we learned was that the advances that cloud providers have introduced into networking are very subtle but also very impactful. Let’s dig in and talk about what we’ve learned.
Cloud Democratized the Network Management Plane
This is more of a starting place than a new insight, but we should begin with the obvious. Cloud providers allow anyone to create and change networks, instantly. This is in many ways, one of the main reasons that the cloud has been so successful. Companies that are getting started in the cloud no longer need to understand networking very well to have an app running. And the benefits of a democratized network carry forward even as cloud networks mature. Cloud providers have done such a good job of building resilient networks, with layers of amazing virtualization on top, that network hardware failures rarely become the problem of the network engineer.
People Think That the Network Matters Less
This incredible advancement has added weight to a very old and very baseless idea that the network shouldn’t matter anymore. While we are inclined to roll our eyes when we hear these sentiments, we should admit that things have changed. Fifteen years ago you couldn’t launch a new business or even run a school without having a server, a switch, and a router sitting in a rack somewhere. But those days are gone. Adapt or die.
But instead of adapting, many organizations moving to the cloud swallow this lie hook, line and sinker and build cloud architectures without consulting people that understand how networks work. I can’t tell you how many times we have spoken with network teams that are waiting for such a call, despite knowing their organizations are struggling to build scalable and performant cloud networks.
Cloud is Dissolving the Network Edge
While the network team waits, the cloud perimeter is dissolving. Think of it this way: The network has always served as a boundary where organizations apply policies to control costs, enforce security and ensure the performance of their applications and infrastructure. And we’ve invested heavily to maintain this boundary. Consider the edge components of an on-prem network: the expensive routers, switches, and firewalls. The SD-WAN systems, the DDoS scrubbers, and the intrusion detection appliances. And then we back up these hardware investments by hiring smart, highly qualified individuals to run it all. We don’t hand out the passwords to these devices to just anyone.
But when cloud providers supply the tools that allow anyone to set up network infrastructure — they’ve done exactly that. Most organizations don’t have policies in place that prevent accounts from setting up new internet gateways, configuring new security groups, or routing policies. In fact, many organizations encourage this because it allows these teams to move fast.
Network Teams Are Called in Too Late
Organizations can bury their heads in the sand for one or two iterations as they move into the cloud, but eventually the problems they are facing become acute: connectivity issues are slowing deployments. Security has no visibility. Network costs are surging. Time to call in the pros.
When these teams come in to look, the problems are already baked into the environment and need careful extraction. Teams need to understand the traffic flows and architectural patterns before they can start to craft a plan to address the issues and methodically solve the problems. But how? The teams need tools.
The Old Tools Aren’t Up to the Job
Naturally, network teams try to solve these problems by first looking at the tools that they have been using to monitor their on-prem networks. But this isn’t cutting it. Built primarily as simple metrics warehouses, most “legacy” network monitoring vendors modified their platforms to support the cloud by simply ingesting a few cloud metrics from services like AWS CloudWatch or adding support for simple, unenriched VPC flow logs. The end products have limited value. The metrics collected help paint a vague picture of the cloud but don’t address any of the larger problems at play. Ingesting VPC flow logs is a good start, but what good does it do when containers spin up and down in minutes, workloads are transportable and everything runs on some kind of overlay network?
This approach also can’t handle cloud scale. Some of the customers we chatted with were routinely generating 90 TB of flow logs a month. Try throwing that at a virtual appliance. Try throwing that into a massive cluster and keeping your queries running fast. It doesn’t work.
And frankly, most people aren’t interested in making it work, because our thinking has shifted away from a must-build-everything mentality towards one where teams want to focus on what they are good at — engineering networks. Network engineers want to add value by exercising their core competencies, not oversee the care and feeding of storage and compute. We don’t think like that anymore.
And the New Tools Aren’t Up for It Either…
With “legacy” tools off the table, many teams started trying to solve these problems using the tools that come bundled with their cloud providers. This, too, has largely been an exercise in frustration, as network engineers realized quickly that they were not the consumers these tools were designed for. Yes, they can get a list of top talkers on an interface, but first, they have to learn to write SQL queries. Yes, they can get metrics from their gateways and load balancers, but setting up thresholds and baselines requires a degree in data science. Yes, they can configure VPC flow logs, but then they need to figure out how to enrich the records to make them meaningful. The bottom line is that cloud providers wrote these tools as primitives designed to be used by developers, primarily for monitoring applications — not cloud networks. And of course, these tools don’t pay any attention to the fact that 72 percent of cloud networks use hybrid and/or multi-cloud architectures1 — leaving serious visibility gaps on the table.
So what about the new full-stack observability tools? Despite being super interesting and full of promise, the reality is that most of these agent-based solutions don’t take a network-centric approach. Designed largely for developer-centric use cases like application performance monitoring or SRE use cases of logs, traces and metrics, these tools don’t come close to helping teams detangle connectivity issues, address routing problems or find performance problems.
What Makes Kentik Cloud Different?
Kentik Cloud provides enterprises with the ability to observe their public and hybrid cloud environments and understand how cloud networks impact user experience, application performance, costs, and security. By showing a unified end-to-end network view to, from, and across public clouds, the internet, and on-premises infrastructures, Kentik Cloud helps network engineers to quickly solve problems and dramatically improve their cloud networks. Networking teams that use Kentik Cloud will love the rich visualizations, lightning-quick speed, and thoughtful workflows that illuminate the paths, performance, traffic, and inter-connectivity that comprise their cloud networks.
The solution introduces several new exciting features and capabilities.
Observation Deck™
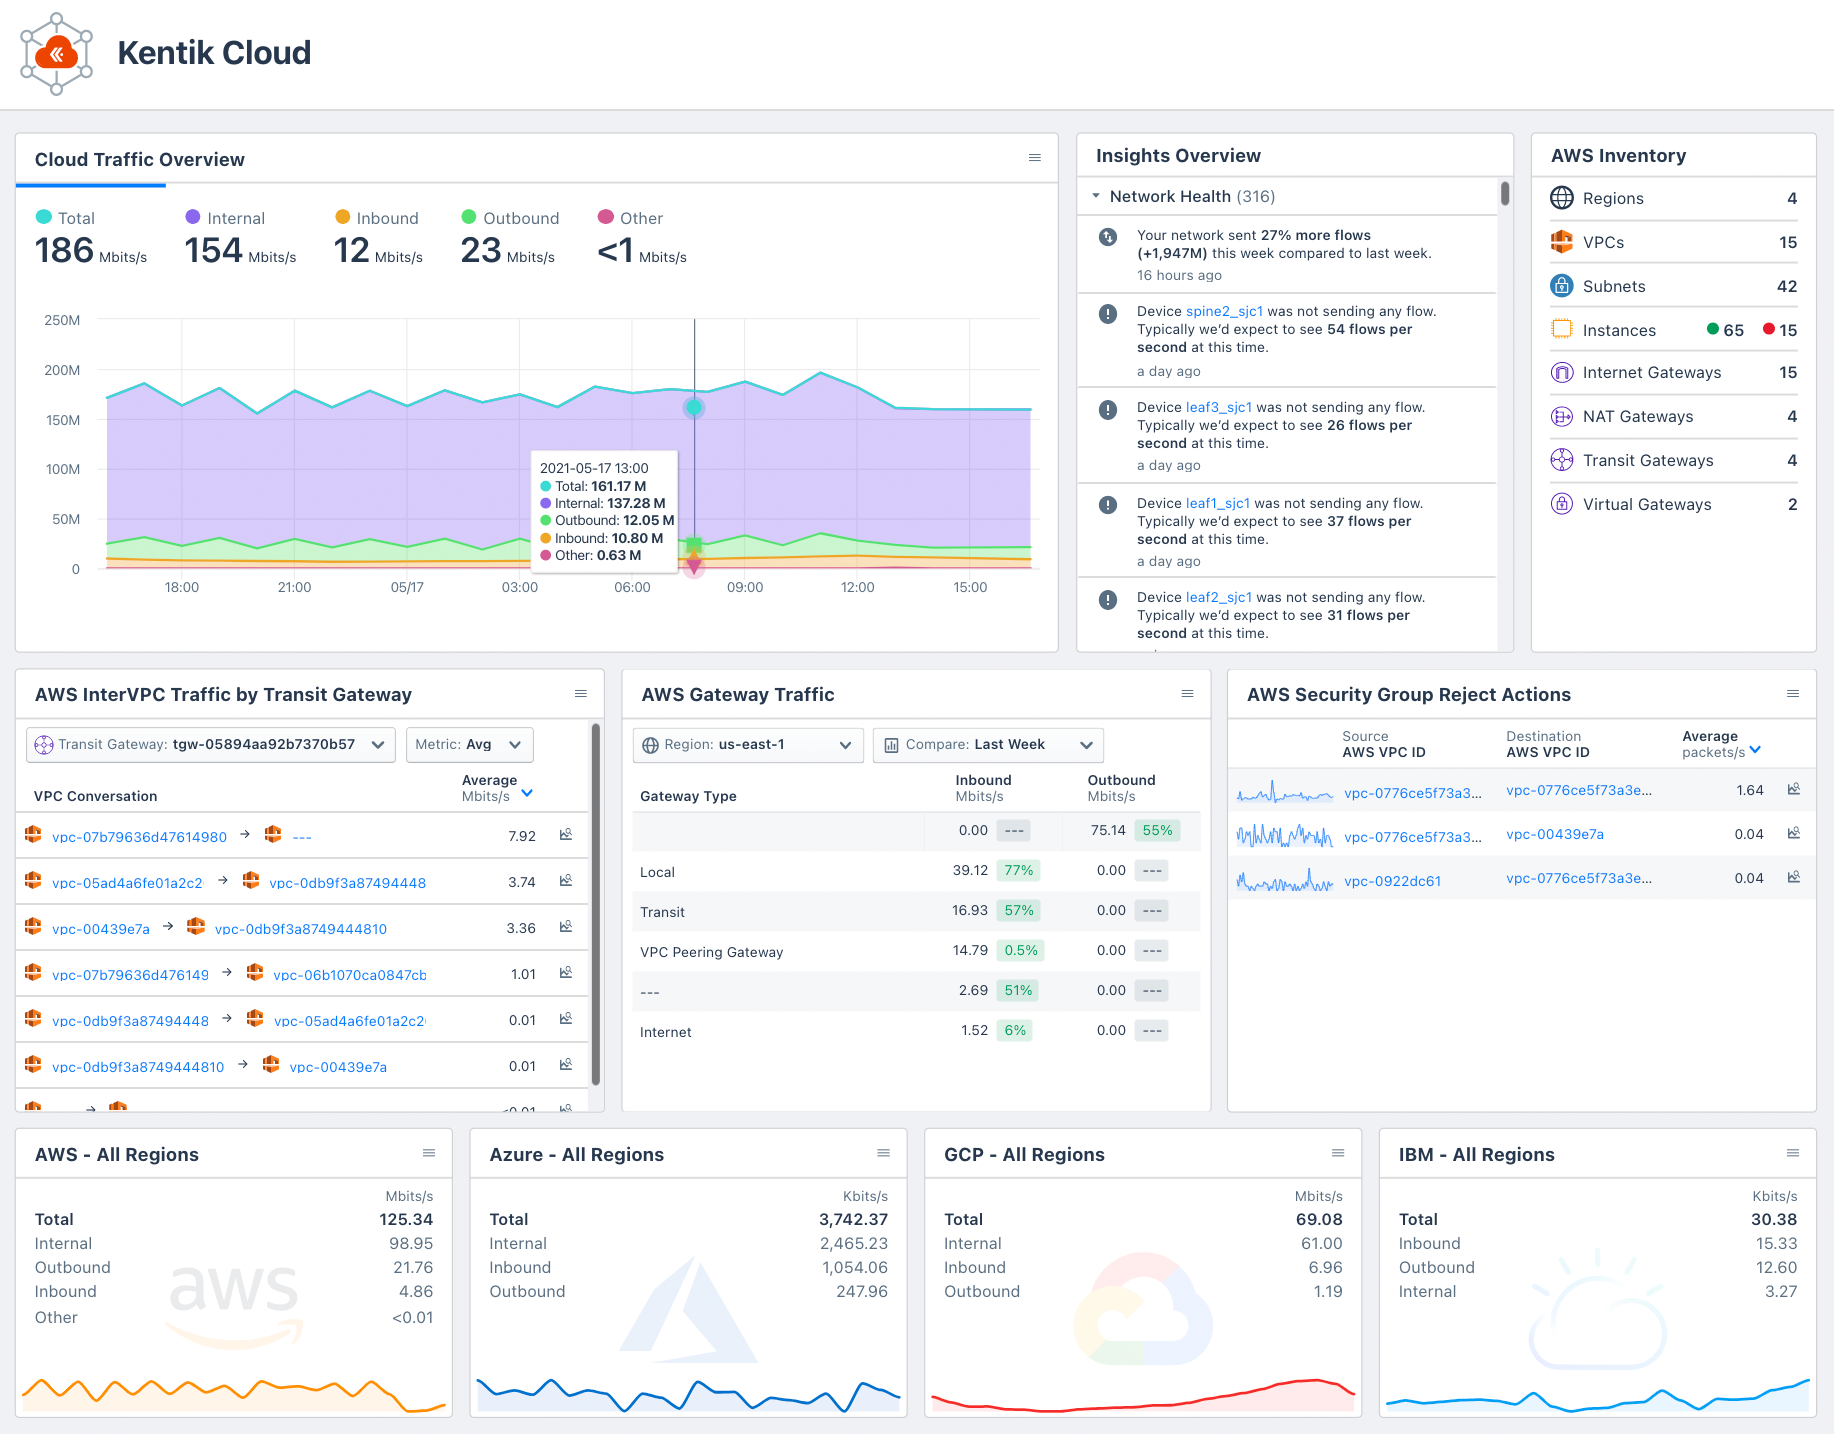
The Observation Deck™ was built on the idea that customers often use Kentik to build dashboards that meaningfully represent the infrastructure and use cases most relevant to them and then switch back and forth between these views and the Kentik workflows they love. The Observation Deck allows people to choose their favorite Kentik components (which are pre-built as “widgets”) and places them side-by-side with their custom views, including their Data Explorer, dashboards, etc. This puts the information our customers need front-and-center.
Although officially part of the Kentik Cloud release, the Observation Deck isn’t limited to only our cloud subscribers — everyone using our platform will be able to enjoy it. Cheers!
Kentik Map Enhancements for Cloud
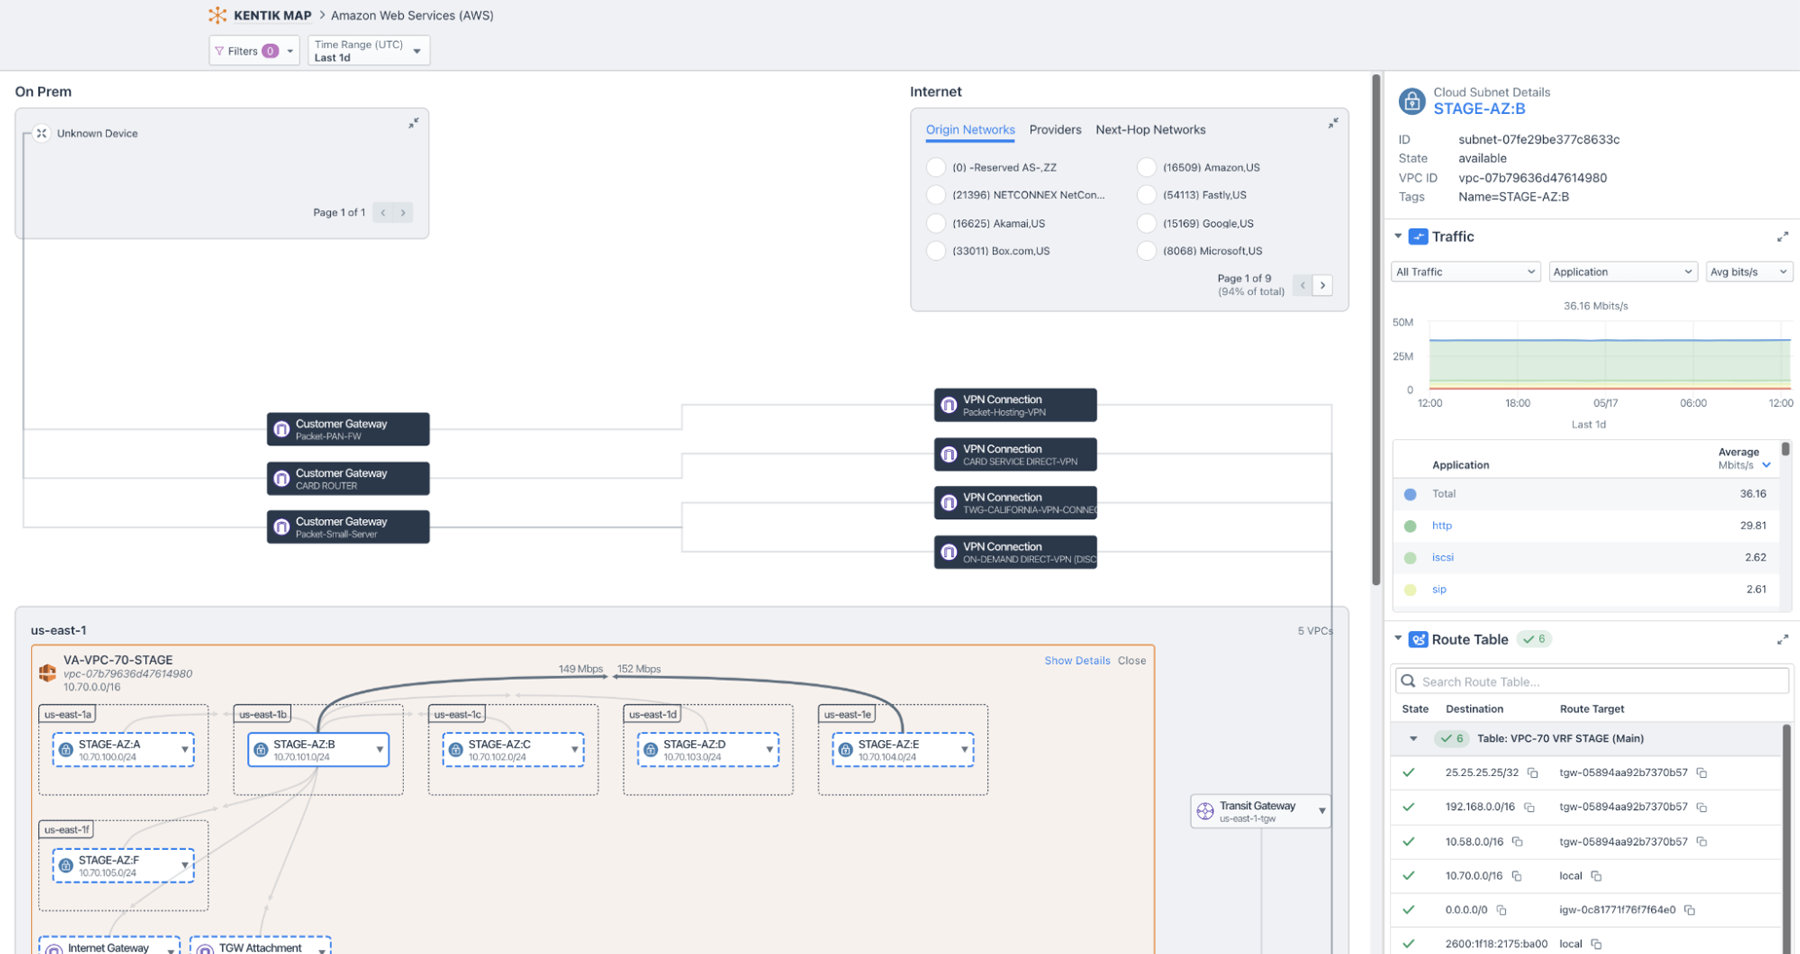
The Kentik Map is all about helping users ask and answer questions about their data in the context of their architectures. These latest enhancements truly deliver on this promise for cloud users by highlighting the most important elements that cloud networkers care about — the data paths, gateways, route tables, traffic data — and the metadata that puts this all into perspective — in one single, easy-to-use, and beautiful interface.
People can use the map to discover misrouted, rejected, or unwanted traffic patterns. Using the map to understand the flow of traffic around your cloud environment is so easy that you’ll never want to use your cloud console again. Best of all, the map is integrated with your on-prem data so you can now enjoy a complete and seamless experience as you troubleshoot issues in your data center through to your VPC architectures.
Cloud Performance Monitor
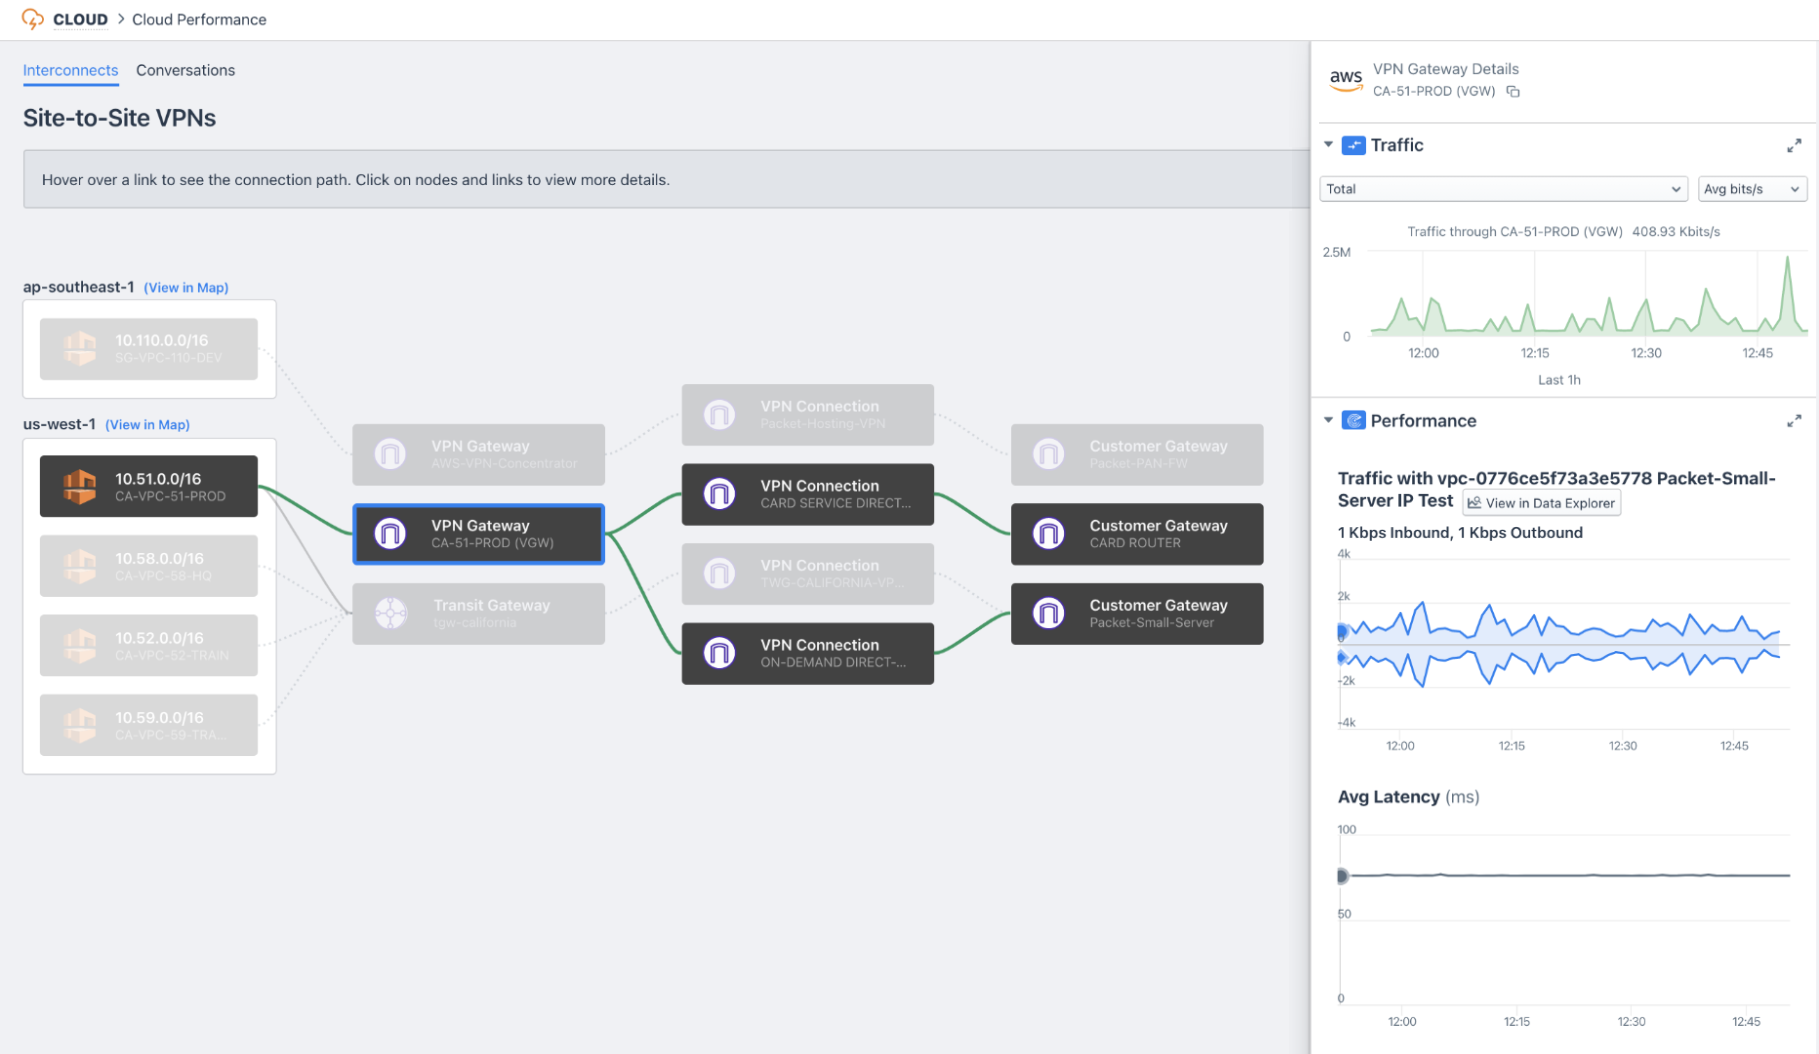
Cloud Performance Monitor extends the power of Kentik Synthetics by helping cloud users understand the paths that traffic is taking through their network so they can set up our synthetics agents in the most appropriate places. The workflow is broken down into two components.
The Interconnects tab helps users gain a complete picture of how their data flows across the critical infrastructure “gluing” their cloud environment to their data centers and remote offices. The Conversations tab uses flow data to identify the inter-VPC communication paths inside cloud environments so that users can pinpoint the parts of their network that would readily benefit from active performance monitoring. Without Kentik Cloud, understanding these architectures and finding these traffic patterns can be difficult, making performance monitoring challenging. With Kentik Cloud, it’s a breeze; just point, click, and register a synthetic agent in seconds.
Automated Configuration and Onboarding Improvements
This release of Kentik Cloud also features several small but mighty enhancements that we’re proud to share with you.
First, we’ve dramatically improved our onboarding experience by giving users two paths to get up and running on Kentik Cloud — an automated path based on Terraform, and a manual path with easy validation. The Terraform path builds a Terraform configuration template based on user preferences, making it simple to configure your AWS environment in seconds. The generated configuration relies on the popular AWS Terraform provider to enable flow logs on your VPCs, configure the collection buckets and required access policies. Then, the configuration uses our brand new Kentik Terraform provider to automatically register each VPC from every monitored account in the Kentik platform.
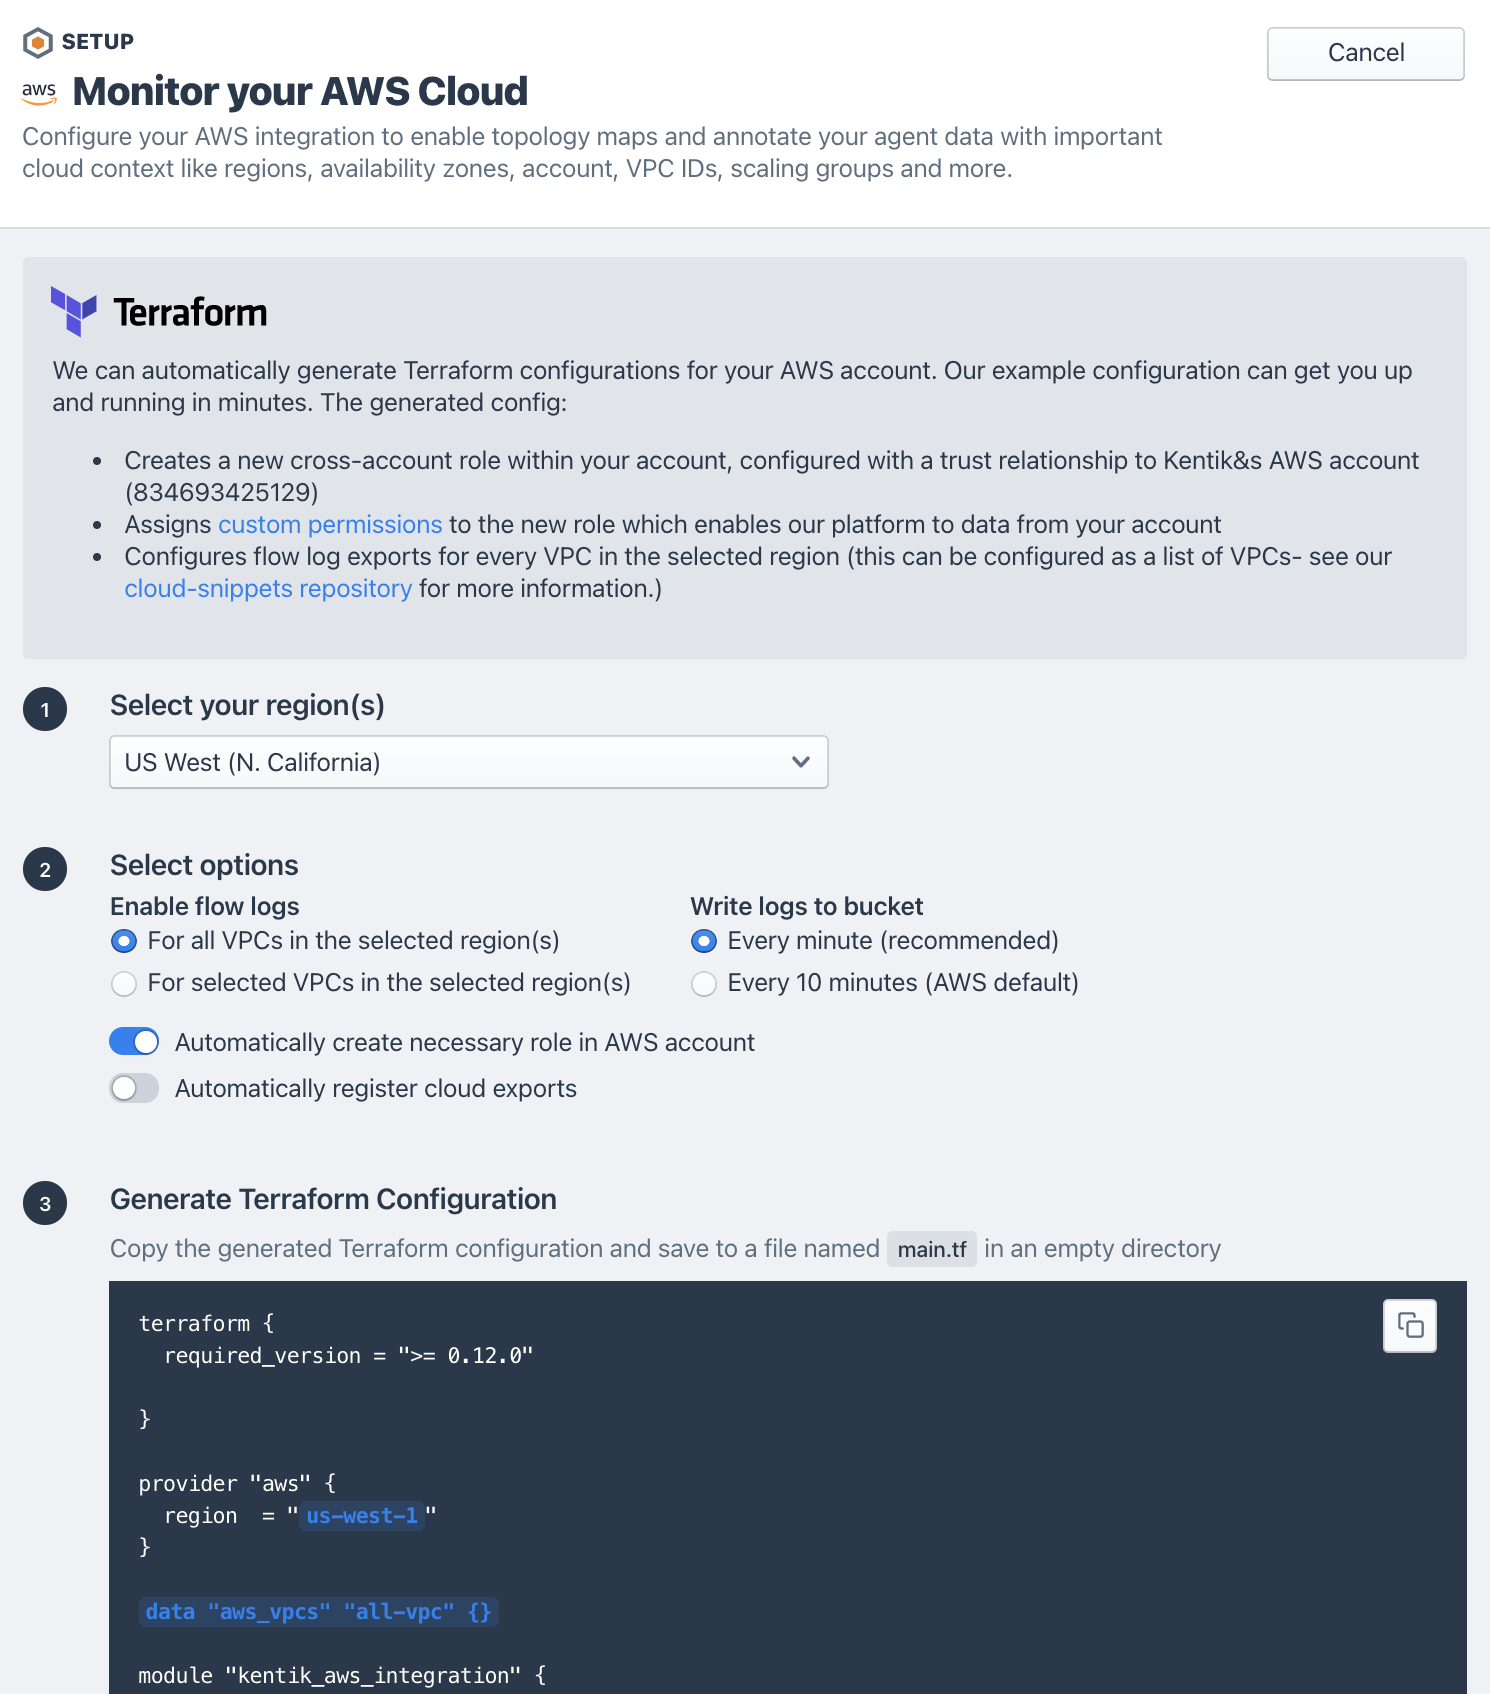
Our manual onboarding improvements are real time-savers as well. In previous setup screens for AWS, we asked users to input role ARNS, buckets, and regions before providing any kind of attempt to validate our success in being able to ingest cloud flow logs. The result was that users who had a misconfiguration weren’t sure what to fix. We’ve improved this experience by adding validation buttons for each step along the way.
New Data Explorer Dimensions
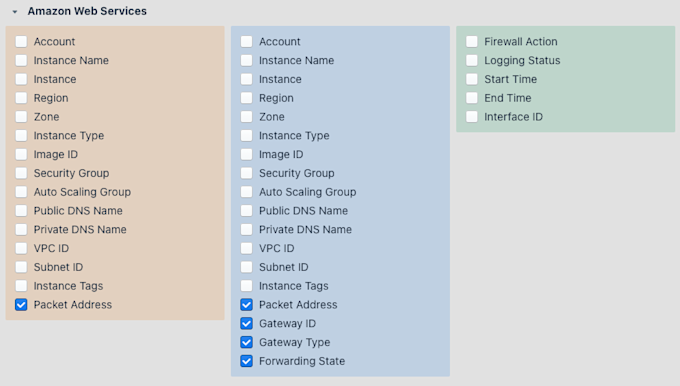
We’ve also added a few new dimensions to the Data Explorer that are super useful for AWS users.
Packet Address: AWS recently added the ability to see inside network overlays (GRE, etc.) to the raw source and destination IP addresses in your VPCs. This is useful when you’re troubleshooting transit gateway Connect attachments, NAT gateways, or any kind of traffic with unencrypted overlays.
Gateway ID/Gateway Type: This is one of our most exciting AWS data dimensions, allowing you to see exactly what traffic crossed various gateways. This is useful when you’re trying to understand how traffic is flowing through your network, or are working to implement new gateways or retire old ones.
Forwarding State: This dimension enriches flow records with the route state of the destination prefix. If traffic is flowing towards a route with an active route, the forwarding state will be marked as “active.” However, if traffic is destined towards a blackhole route, the state will reflect this with a value of “blackholed.”
Next Steps
In addition to polishing what we’ve already started, we’ve got so much more exciting work planned over the next few quarters: connectivity troubleshooting workflows, new cloud widgets, map enhancements, and support for new authentication features in AWS. We’re also excited to extend capabilities in our maps to Azure, Google Cloud and IBM clouds in the coming quarters. Stay tuned!
Get Started
If you’d like to learn more, you can spin up a 30-day free trial in minutes. If you’d like more information, contact us or join us on Kentik Users Community Slack where you can chat live with product experts and get your questions answered in real time.
…Or See for Yourself During Our Upcoming Webinar
If you’d like to see Kentik Cloud in action, using real data to attack specific use cases, I’d also like to invite you to join our upcoming webinar this Thursday, May 20 on “How to Troubleshoot Routing and Connectivity in Your AWS Environment.”


