Why Your Data-Driven Strategies for Network Reliability Aren’t Working


Summary
What do network operators want most from all their hard work? The answer is a stable, reliable, performant network that delivers great application experiences to people. In daily network operations, that means deep, extensive, and reliable network observability. In other words, the answer is a data-driven approach to gathering and analyzing a large volume and variety of network telemetry so that engineers have the insight they need to keep things running smoothly.
What do network engineers working in the trenches, slinging packets, untangling coils of fiber, and spending too much time in the hot aisle really want from all their efforts? The answer is simple. They want a rock-solid, reliable, stable network that doesn’t keep them awake at night and ensures great application performance.
So how do we get there? What do we have to do short of locking all end-users out of their computers to have five minutes of peace?
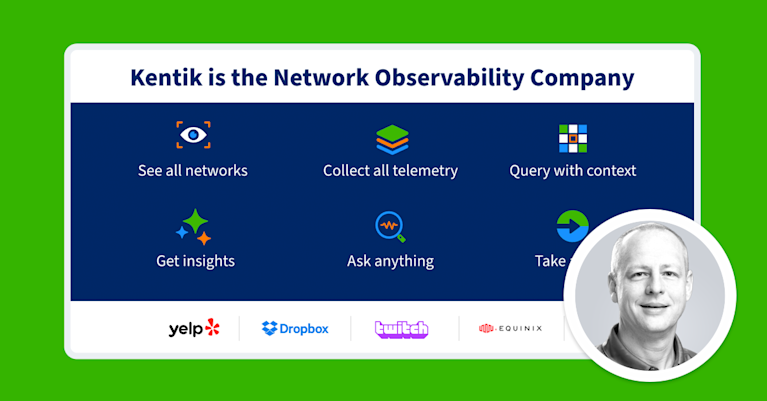
This was what Kentik was all about at Networking Field Day 31. We believe a data-driven approach to network operations is the key to maintaining the mechanism that delivers applications from data centers, public clouds, and containerized architectures to actual human beings. Ultimately, we’re solving a network operations problem using a data-driven approach.
More data!

A data-driven approach means nothing if it doesn’t mean more data. If you think about everything application traffic flows through between its source and destination, the sheer variety and volume of physical and virtual devices are enormous. Some of these devices an enterprise network engineer owns and manages, and a lot of it they don’t.
Rather than collecting only flow data from routers, or only eBPF information from containers, the fact that application traffic traverses so many devices means we need much more data to get an accurate view of what’s happening.
Only then can we pinpoint why one of our data center ToR switches is overwhelmed with unexpected traffic, why our line of business application is experiencing latency over the SD-WAN, why an OSPF adjacency is flapping, or why our SaaS app performance is terrible despite having a ton of available bandwidth.
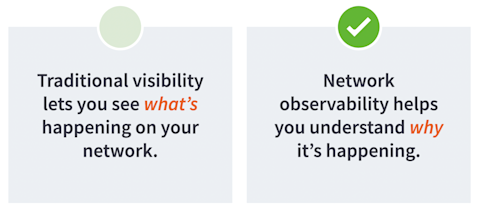
These are all examples of instability with our network and its adverse effects on application performance. But notice all of these examples start with “why.” That’s a big difference between traditional network visibility and modern network observability.
Seeing and understanding
You can think of network observability as the difference between seeing and understanding. It’s the difference between simply seeing more data points on pretty graphs and understanding why something happened. It’s a difficult leap to make, and it requires as much telemetry as we can get our hands on (hence more data).
And this is one big reason that Kentik’s approach starts with data and not features; it’s data-driven from the start because, just like we learned in our boring high school statistics class, the larger the dataset, the more accurate our predictions, the more likely it is we’ll find a strong correlation, and the more precise our understanding of what’s happening on the network.
In the context of modern networking, this means a lot more than it used to. There was a day when flow and SNMP were enough, but that’s not the case today. Today, when we learn that an application is slow, we need to be able to pinpoint precisely where in the path latency is happening. And when we find that, we’ll want to see interface errors, DNS response times, TCP retransmissions from container resources, and so on, all in a time series to identify what is causing that latency.
Just seeing more data points won’t help maintain a reliable network, but understanding how those data points relate to each other will.
Volume and variety
As much as we need all this data, it does create two problems for us.
Think again about everything involved with handling packets, including network-adjacent services that don’t necessarily forward packets, but are critical for getting your application from containers in AWS to the cell phone in your hand.
Here’s a ridiculous list for you:
- Switches
- Routers
- Firewalls
- CASBs
- IDS/IPS appliances
- Wireless access points
- Public clouds
- Network load balancers
- Application load balancers
- Service provider networks
- 5G networks
- Data center overlays
- SD-WAN overlays
- Container network interfaces
- Proxies
- DHCP services
- IPAM databases
…and the list goes on.
Now think about every make and model of device and service for each of the network elements I just listed. Then think of all the types of data we can collect from these devices. I almost want to create another ridiculous list below to prove my point, but I’m confident you get the idea.
So, the first problem is the sheer volume of data we have. Volume in and of itself isn’t a problem, but what is a problem is querying that data extremely fast while troubleshooting an issue in real time. Remember how we’re collecting telemetry from about eleventy billion devices? That means a querying engine needs to work extra hard to filter through exactly what you’re looking for, even as new data is ingested into the system.
Filtering a query quickly is critical for network operations, but it’s difficult when querying a massive database filled with disparate data types.
The second problem is related to the first, but instead of the volume of data, it’s how many different types of data we have to deal with. We have flow records, security tags, SNMP metrics, VPC flow logs, eBPF metrics, threat feeds, routing tables, DNS mappings, geo-id information, etc.
Each telemetry type exists in very different formats, often using completely different scales. A metric about throughput would be in millions of bits or packets per second, whereas a flow record may give you source and destination information. A security tag is a random identifier, not a quantity of anything. Different formats and scales require an entire workflow to pre-process the data before applying an algorithm or machine learning model.
A data-driven approach to network observability uses an ML pre-processing workflow to solve this problem by scaling and normalizing the data. This step alone may provide enough insight that a straightforward statistical analysis algorithm or time series model can produce the understanding a network engineer needs to find correlations, identify patterns, and predict network behavior.
A new world of network telemetry
Justin Ryburn, Kentik’s VP of global solutions engineering, explained that the list of data we need to collect is only getting bigger. Many applications are built on containers, each of which has a network interface of some type (depending on the type of container). That means we now also need to collect container network information as part of our overall network telemetry dataset.
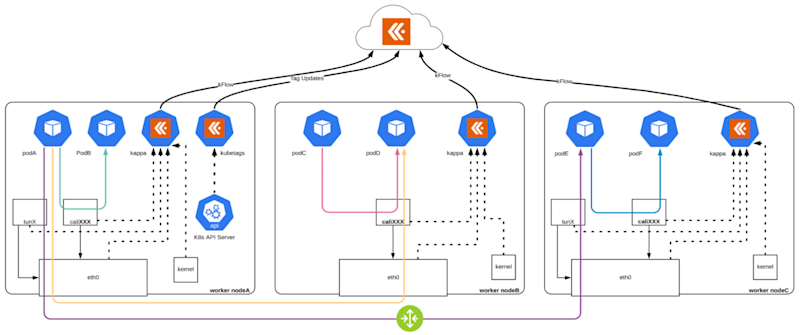
Using eBPF, we can observe the interaction between an application and the underlying Linux kernel within the application’s container for resources and network processes. Kappa, Kentik’s host-based telemetry agent, is built on eBPF to provide ultra-efficient observability for containers on-prem and in the cloud.
And since we rely so much on the public cloud today, Ted Turner, cloud solutions architect at Kentik, explained how important it is to collect whatever cloud flow logs we can and combine it with other relevant telemetry, such as the metrics we can learn from SaaS providers, public internet service providers, DNS databases, and so on.

With all this data in one place, we can map how traffic flows among our cloud instances, in between our multiple cloud providers, and back to our on-premises data centers (see above).
The key here is that as new technologies emerge, just as containers have in the last few years, new telemetry will need to be collected to give us the best picture of application delivery we can get.
The answer isn’t the one type of data that serves as a magic bullet to give us all the answers. Instead, the answer is a data-driven approach that optimizes the volume and variety of data to provide network engineers the insight they need to maintain a stable, reliable network.
Watch all of Kentik’s presentations at NFD 31 here.
