Solving slow web applications with the Kentik Page Load test


Summary
By peeling back layers of your users’ interactions, you can investigate what’s going on in every aspect of their digital experience — from the network layer all the way to application.
Kentik Synthetics is all about proactive monitoring. With synthetic monitoring, you can investigate users’ digital experience by peeling back, layer by layer, exactly what’s going on in every aspect of the digital experience from the network layer all the way to application.
Because synthetic tests can be so granular, the results provide different information than you can get from flows, streaming telemetry or other observability data. For example, you can test specific DNS activity, HTTPS activity or simulate an actual web transaction. This is a powerful method to proactively monitor digital experience rather than gather data passively.
The Kentik Page Load test
The Kentik Synthetics menu of tests continues to expand rapidly — we recently introduced a range of BGP monitoring capabilities. Page Load test is a way to test how a website loads from specific locations. The process is pretty straightforward — you select which locations you want as your source, you specify a URL, and the system tests a full browser page load using Headless Chromium run by Kentik app agents. The results are a readout of all the status codes, the times for performance indicators response, navigation, domain lookup, etc.
The Page Load test gives you a granular breakdown of how every component on the page is loading so that you can easily track down exactly what’s impacting the site’s performance, whether it’s a site hosted on-premises, in the cloud, or hosted by a SaaS provider.
The Page Load test in action
Take a look at the graphic below in which we’re using the Kentik Synthetics Page Load test to figure out why a website is slow. Notice in the lower left we have several synthetic test agents that live in the Kentik cloud which you can use to monitor pretty much any website you want.
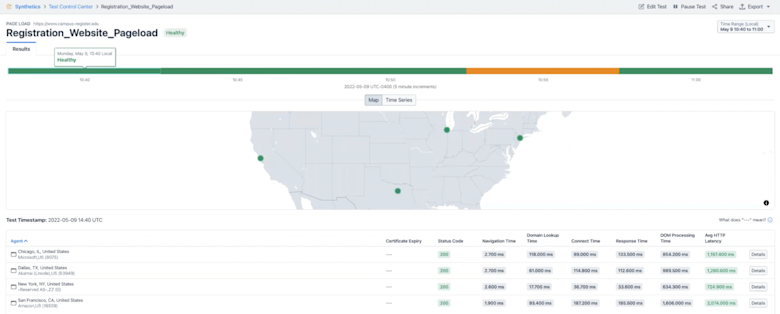
Above on the right you can see individual times for how long different components of the website took to render and load. Notice that you can see the domain lookup time, response time, average HTTP latency, and so on.
The color coded bar at the top of the screen is a warning indicator using an aggregate of these metrics. Green means no problem, of course, whereas orange and red indicate some issue with the website’s performance. These metrics can be based on auto-configured dynamic baselines or manually configured in the advanced configuration for the test.
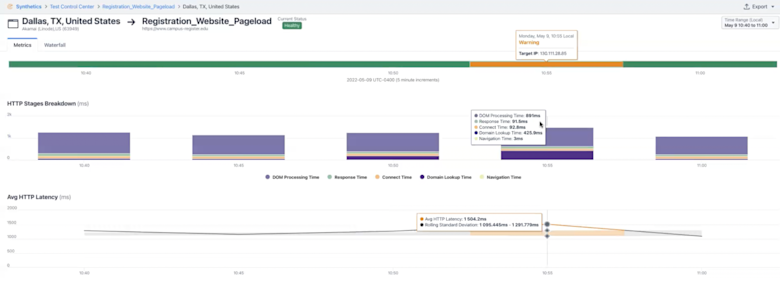
But we need to go even deeper. In the next image below, notice that when you dig into the breakdown of one of the agent tests, you can see right away that there’s a problem, with the DNS lookup time increasing over time.
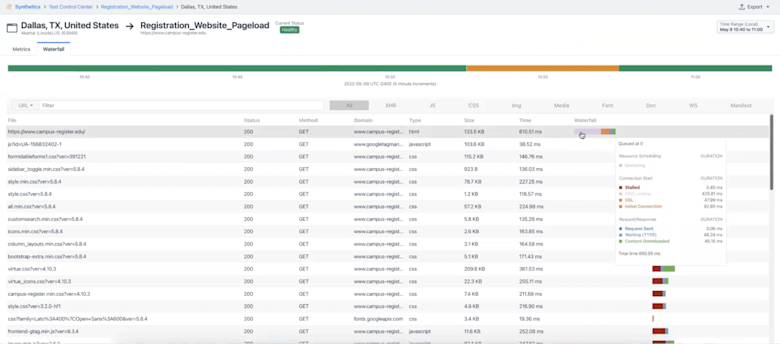
You can open a waterfall view to see the entire rendition of the transaction so you can see how every single individual component of the web page loaded over time. Check out the last screenshot below and notice that you can see the metrics for every GET request in detail.
This is a great way to find the root cause of a slow web application, and in this example you can clearly see the slowness was caused by an inordinately high (and increasing) DNS lookup time. And it’s only a matter of a few clicks to run this test on-going so you can get historical results for this website which can be correlated with your other visibility data.
In this video, one of Kentik’s subject matter experts on Synthetics, Sunil Kodiyan, walks through this scenario and answers some questions about how Kentik Synthetics fits into an overall observability solution.
To learn more about Kentik Synthetics and the Kentik observability platform, sign up for a demo.

