Summary
In part two of our peering series, we look at performance. Read on to see how to understand the services used by your customers.
- Part 1 - Economics: How to understand the cost of your connectivity
- Part 2 - Performance: How to understand the services used by your customers
- Part 3 - Analyze: How to improve your CDN and peering connectivity
- Part 4 - Select: How to find the right transit provider
The peering coordinator’s toolbox is a blog series where we dive deep into the peering coordinator workflow and show how the right tools can help you be successful in your role.
Part 2 - Performance
How to understand the services used by your customers
In part 1 of this series, we created an overview of our interconnection costs. You’re now ready for the next step in the peering-coordinator workflow: understanding traffic on the network.
No matter which kind of network you have, you’ll most likely have a mix of video, SaaS, games and software updates running over your network. And you need to understand what they are and how they’re served to your customers — both internal and external.
Kentik OTT Service Tracking’s classification engine has classified more than 350 different OTT (over-the-top) services and over 50 CDNs (content delivery networks) — and is continuing to add more. This provides you with an easy way to get started.
Which services are the most important for my network?
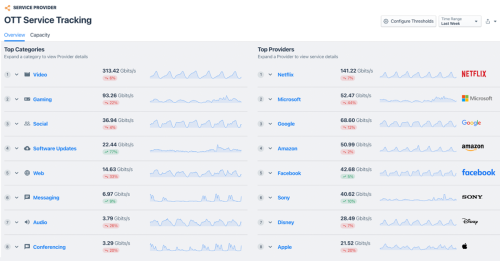
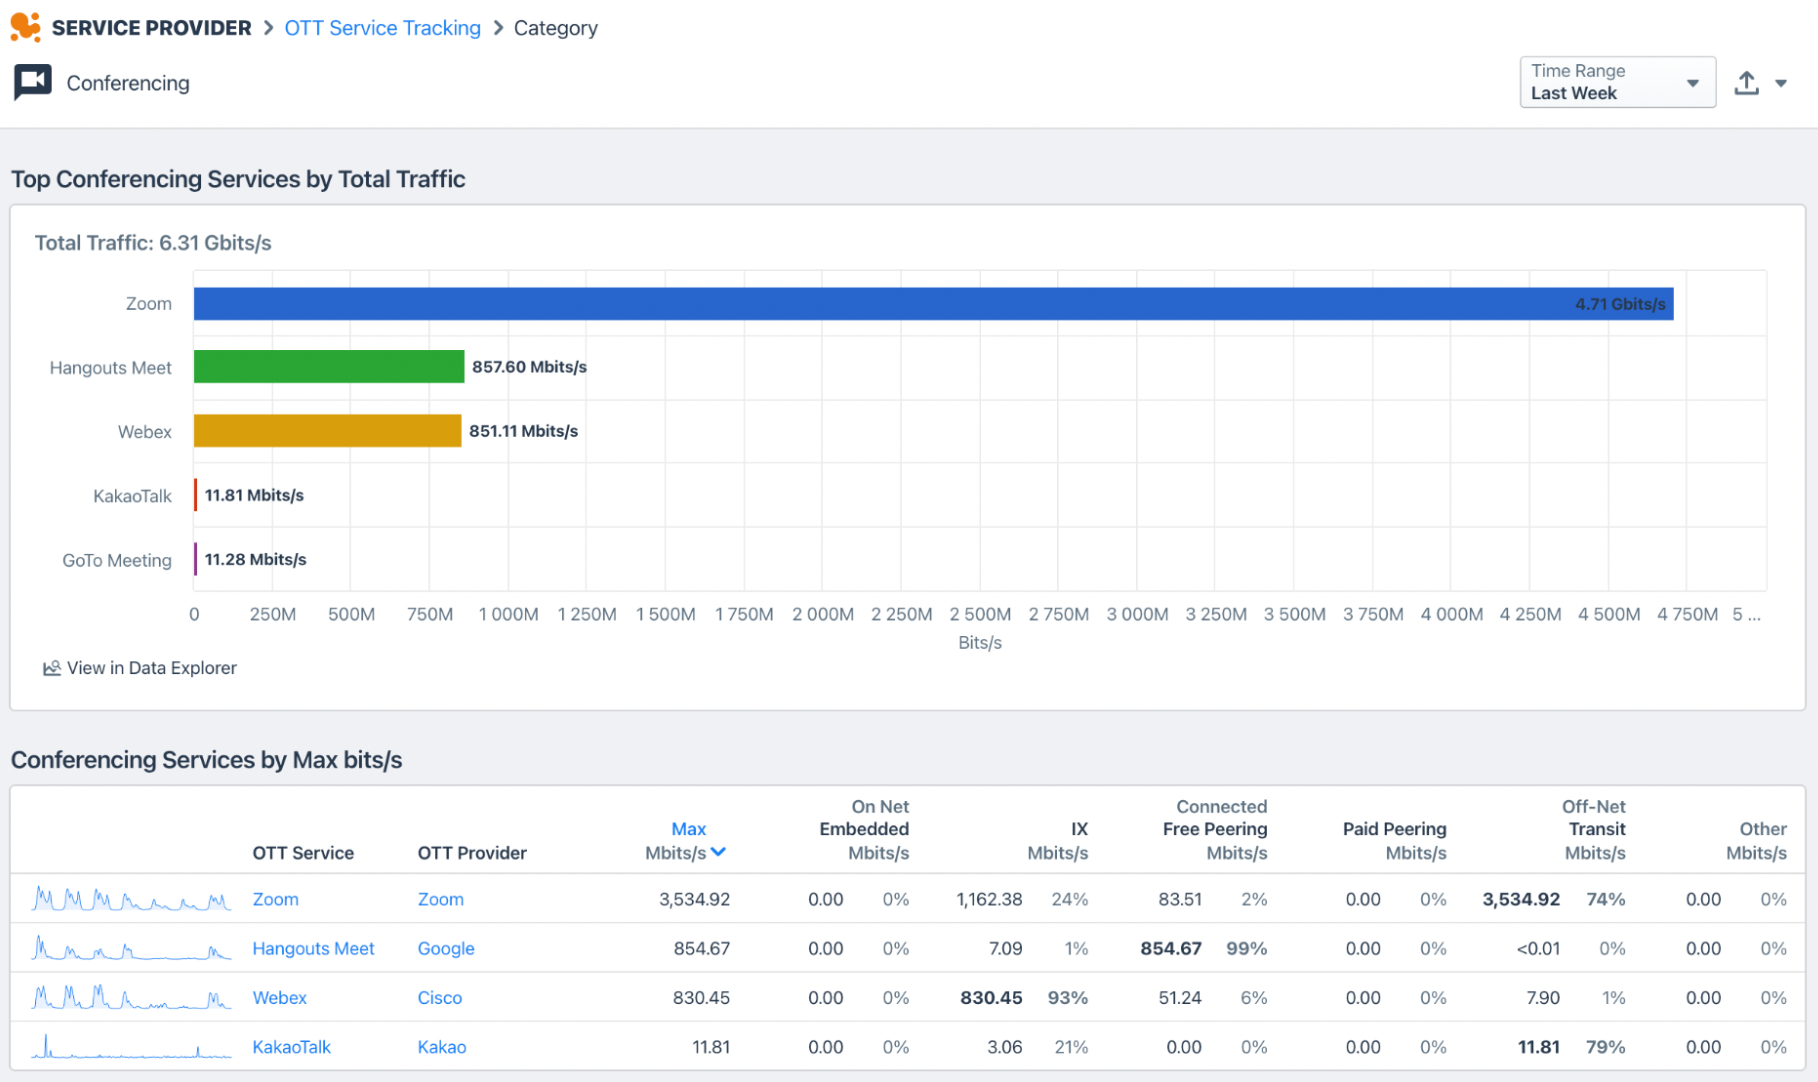
In the image below, you can see an overview of services running on your network and see how much traffic each of the services generate. You can also see which networks are delivering the services to you.
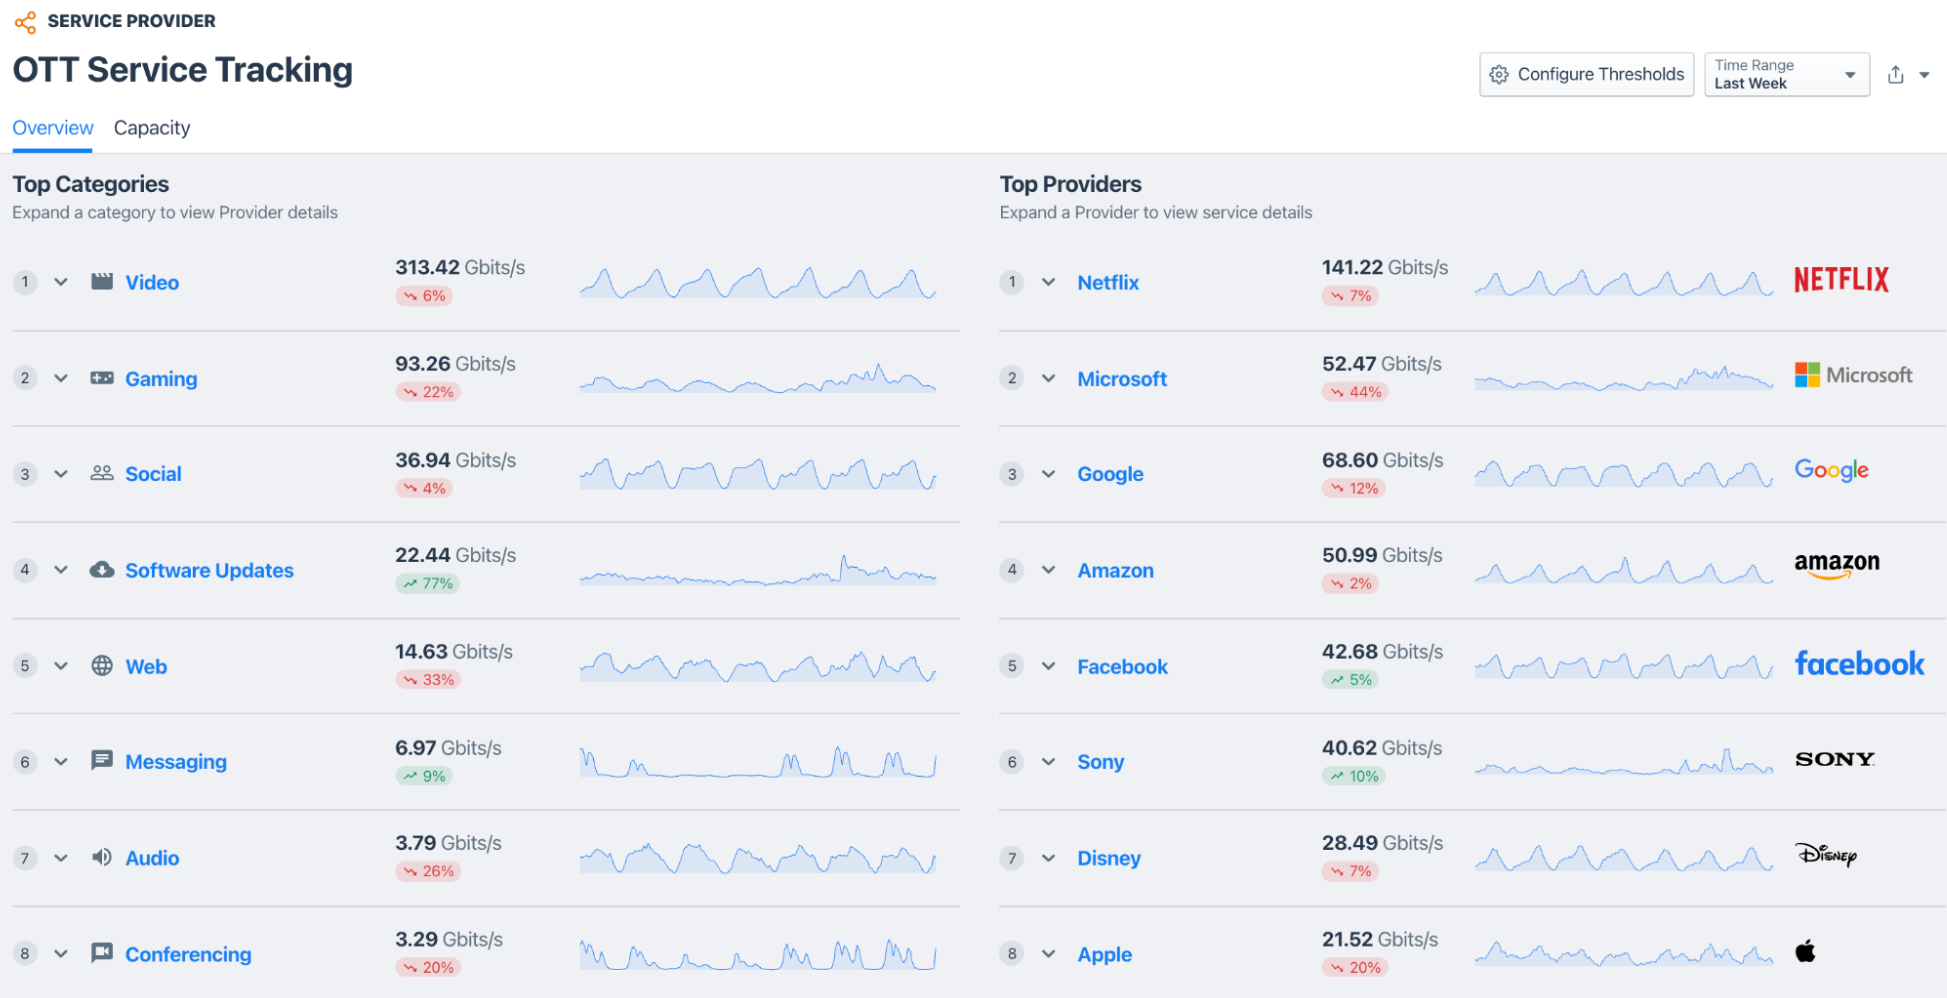
You can also drill down on each of the categories to see how each of the services are served in detail. Let’s take, for example, Zoom — a most-popular video conferencing solution. In the below example, you’ll notice that the majority of this traffic runs over your transit connection (Off-Net Transit).
Evaluate the quality of the service
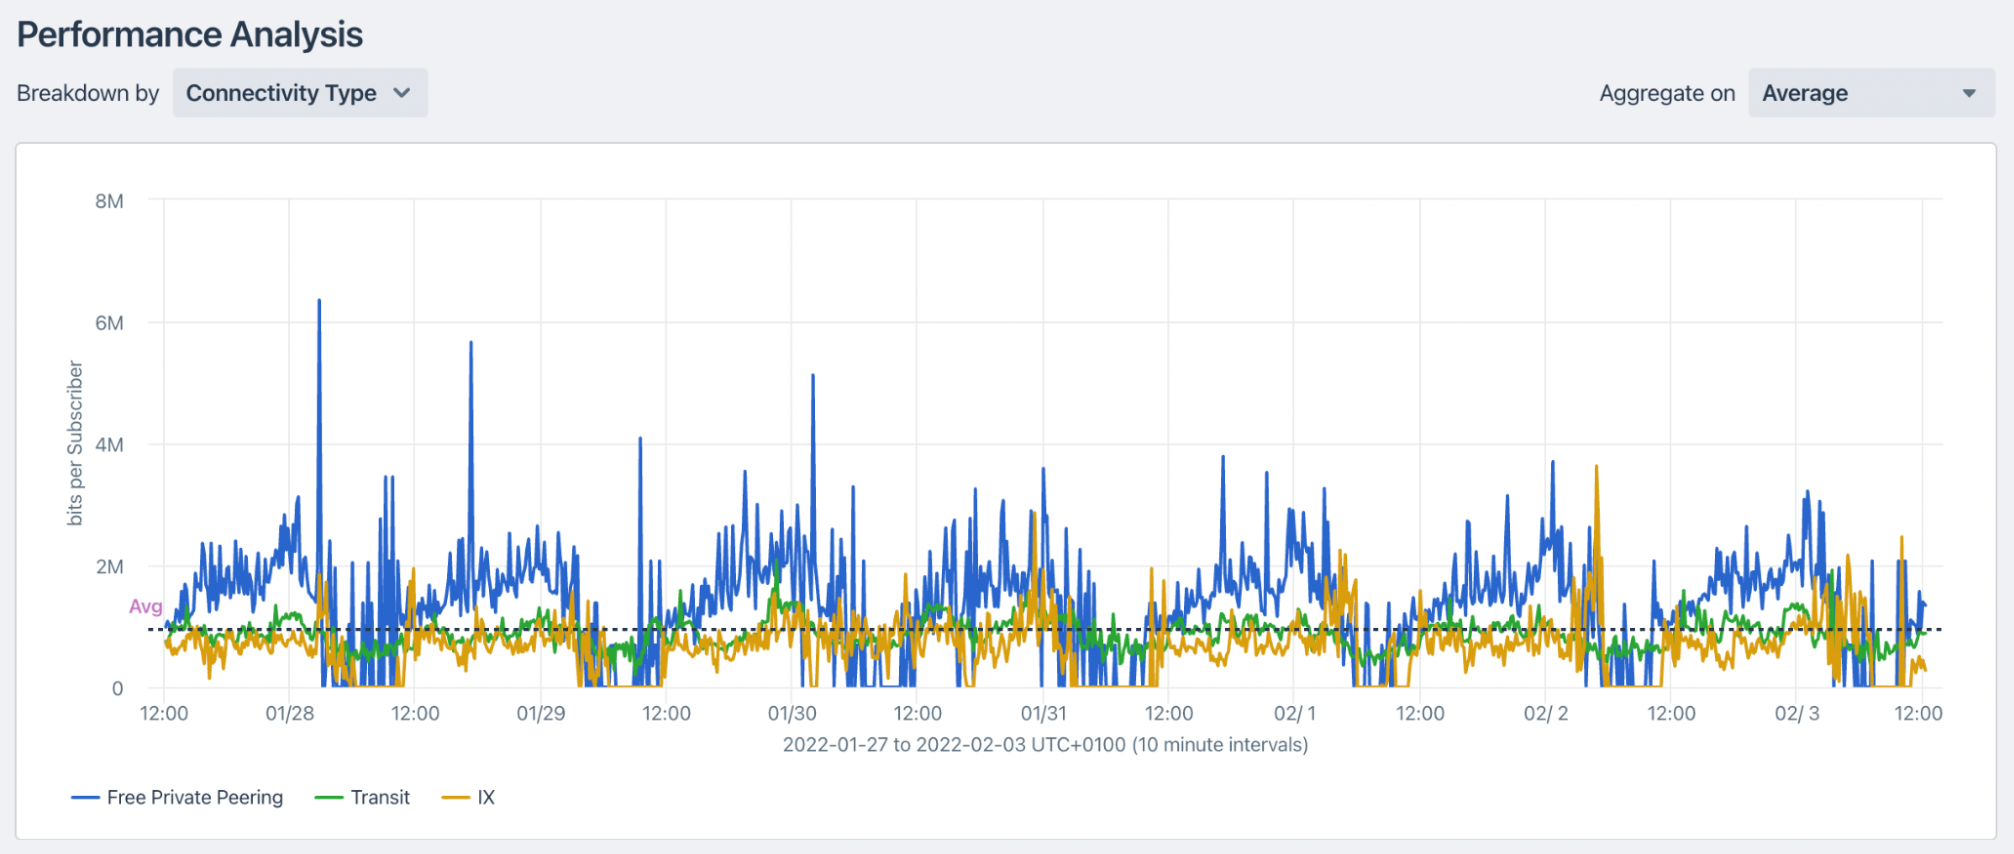
There is a chance that we can improve the price and/or the quality of this traffic by moving more to peering. Drilling into the performance analysis per subscriber below, you can see that the bits per subscriber are significantly higher when the traffic is served via private peering. This indicates that moving the Zoom traffic from your transit to private peering will improve the quality of the Zoom service for your end users.
OTT service and CDNs
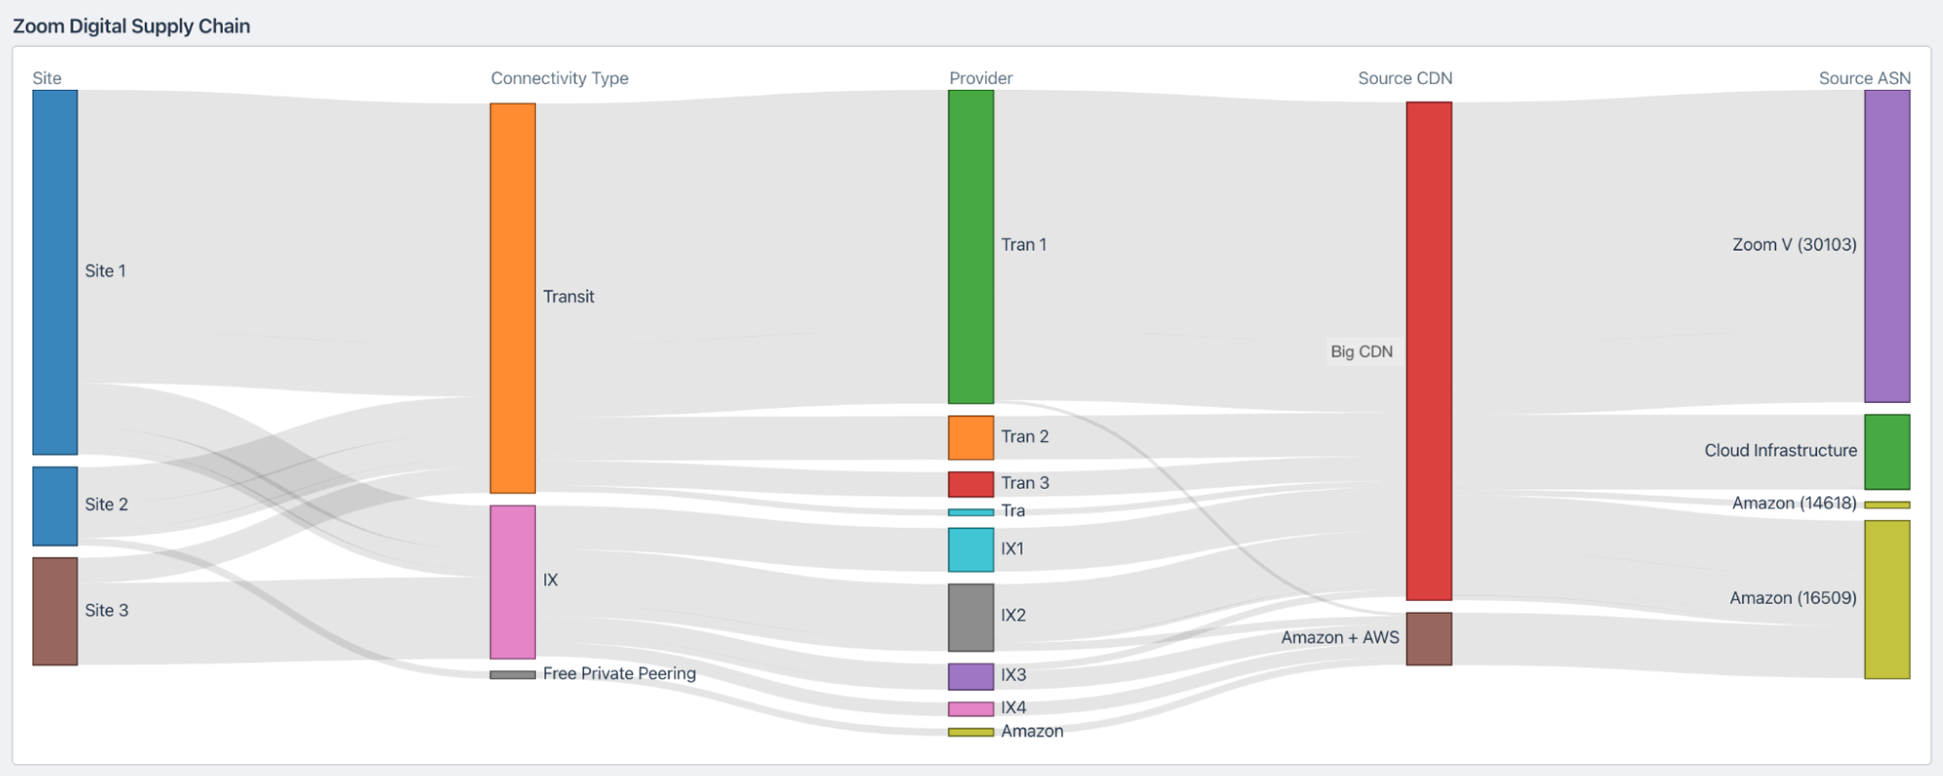
Below you’ll see the digital supply chain view for the Zoom traffic, which will show you how the traffic is served. In this example, the traffic is served via a CDN called Big CDN, so let’s focus on how we can improve all the traffic from Big CDN, including Zoom traffic, by moving away from using transit for this CDN.
Designing a solution
We will first need to think about how the traffic flows internally in your network. The challenge for this exercise is to identify the traffic destinations.
Kentik offers a number of options so that you can configure the view based on the choices your architects have made. Custom Dimensions is the key feature to use. Here you can define and save your custom dimensions and then use them for filtering. You can create dimensions that identify the customers in regions of your network. The options could be IP prefixes, ports, BGP attributes, or even devices if you collect flow from the customer edge.
In our example we have four regions in the network (A, B, C and D), and the external connectivity is located at the sites 1, 2 and 3 from the digital supply chain above. Customers in the four regions are identified by their IP addresses.
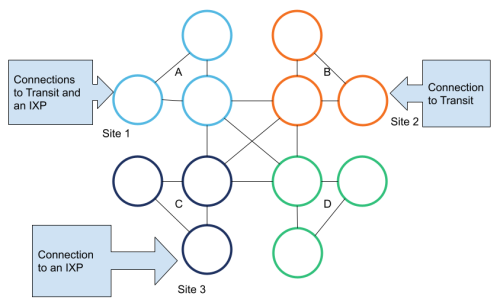
The result of the traffic analysis from Big CDN shows:
| Region 1 | 15 Gbps |
| Region 2 | 21 Gbps |
| Region 3 | 10 Gbps |
| Region 4 | 35 Gbps |
In this case, it will make sense to explore whether private peering to Big CDN in each of the four regions is possible. In part 3 of this blog series, we’ll focus on the process of identifying potential peers and discuss how to prepare a request to peer. But for now, let’s just go with the notion: “We request private peering to Big CDN”.
Let’s assume Big CDN replies back that they are present in the same data center where our Site 3 is located, but they’re not in any other locations where we have a PoP.
Big CDN instead offers servers from their CDN that we can install in our PoPs.
A number of CDNs, in particular those built and operated by content providers, offer servers free of charge to install and connect directly to ISPs network. So, here is another consideration to make: Will the cost of power and space for servers be higher or lower than building your network to carry the traffic from your peering or transit edge to your customers?
A content delivery network, or CDN, is a network of distributed servers with content, a system to distribute the content to where it’s needed, and a system to steer the consumers to the closest server with content. Most steering systems, however, will prefer the servers in a network versus those that are reached via peering, so in the case of our example, we need to make sure that Big CDN supports serving some users via peering and some via the embedded servers.
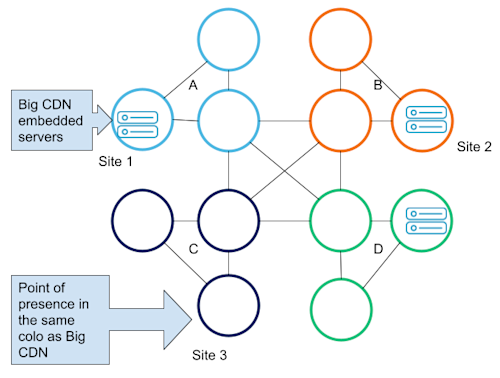
In the case of our example, installing servers in region A, B and D will remove traffic from Big CDN from the backbone links connecting the four regions.
Evaluate the solution
Now we’re able to compare:
- The cost of the transit where Zoom currently is served
- The cost of the private peering to Big CDN
- The cost of power, space and card/router share for the embedded servers in three regions
- Estimated savings on the needed capacity of the backbone links connecting the four regions.
Given that we expect to improve the quality of the service for our customers, we’re now ready to decide whether the savings or the potential extra cost for the service is worth implementing the solution. And once implemented, Kentik Connectivity Costs will make sure you can track the impact of the solution on your cost.
Stay tuned for the next part of this series, where you’ll learn about how to peer off the right amount of the rest of your traffic, work out where you have mutual sites with the peering prospects, and see how you can provide evidence of the value of the peering relationship.
Ready to try it yourself? Start a 30-day free trial.

