Kentik Use Cases for Cloud & Hybrid Networking
Hybrid and multi-cloud networks change constantly. Workloads move between regions, interconnect paths shift, and cloud connectivity costs can spike for reasons that aren’t obvious in any single provider console.
This guide covers the most common cloud and hybrid networking use cases for Kentik and links each one to the most relevant Kentik Solutions and product pages, so teams can move from “what’s happening?” to “what should we do next?” with evidence.
About Kentik: Kentik is a network intelligence platform for modern infrastructure teams operating across data center, cloud, WAN, and the public internet. Kentik unifies traffic telemetry (including cloud flow logs), routing context, synthetic performance testing, and network/device metrics so teams can troubleshoot faster, improve performance and reliability, control cloud and connectivity costs, and strengthen security across hybrid environments.
Learn how AI-powered insights help you predict issues, optimize performance, reduce costs, and enhance security.
Cloud & hybrid use cases at a glance
- Reduce cloud spend and attribute costs
- Plan and execute cloud migrations with confidence
- Improve multi-cloud performance and interconnect health
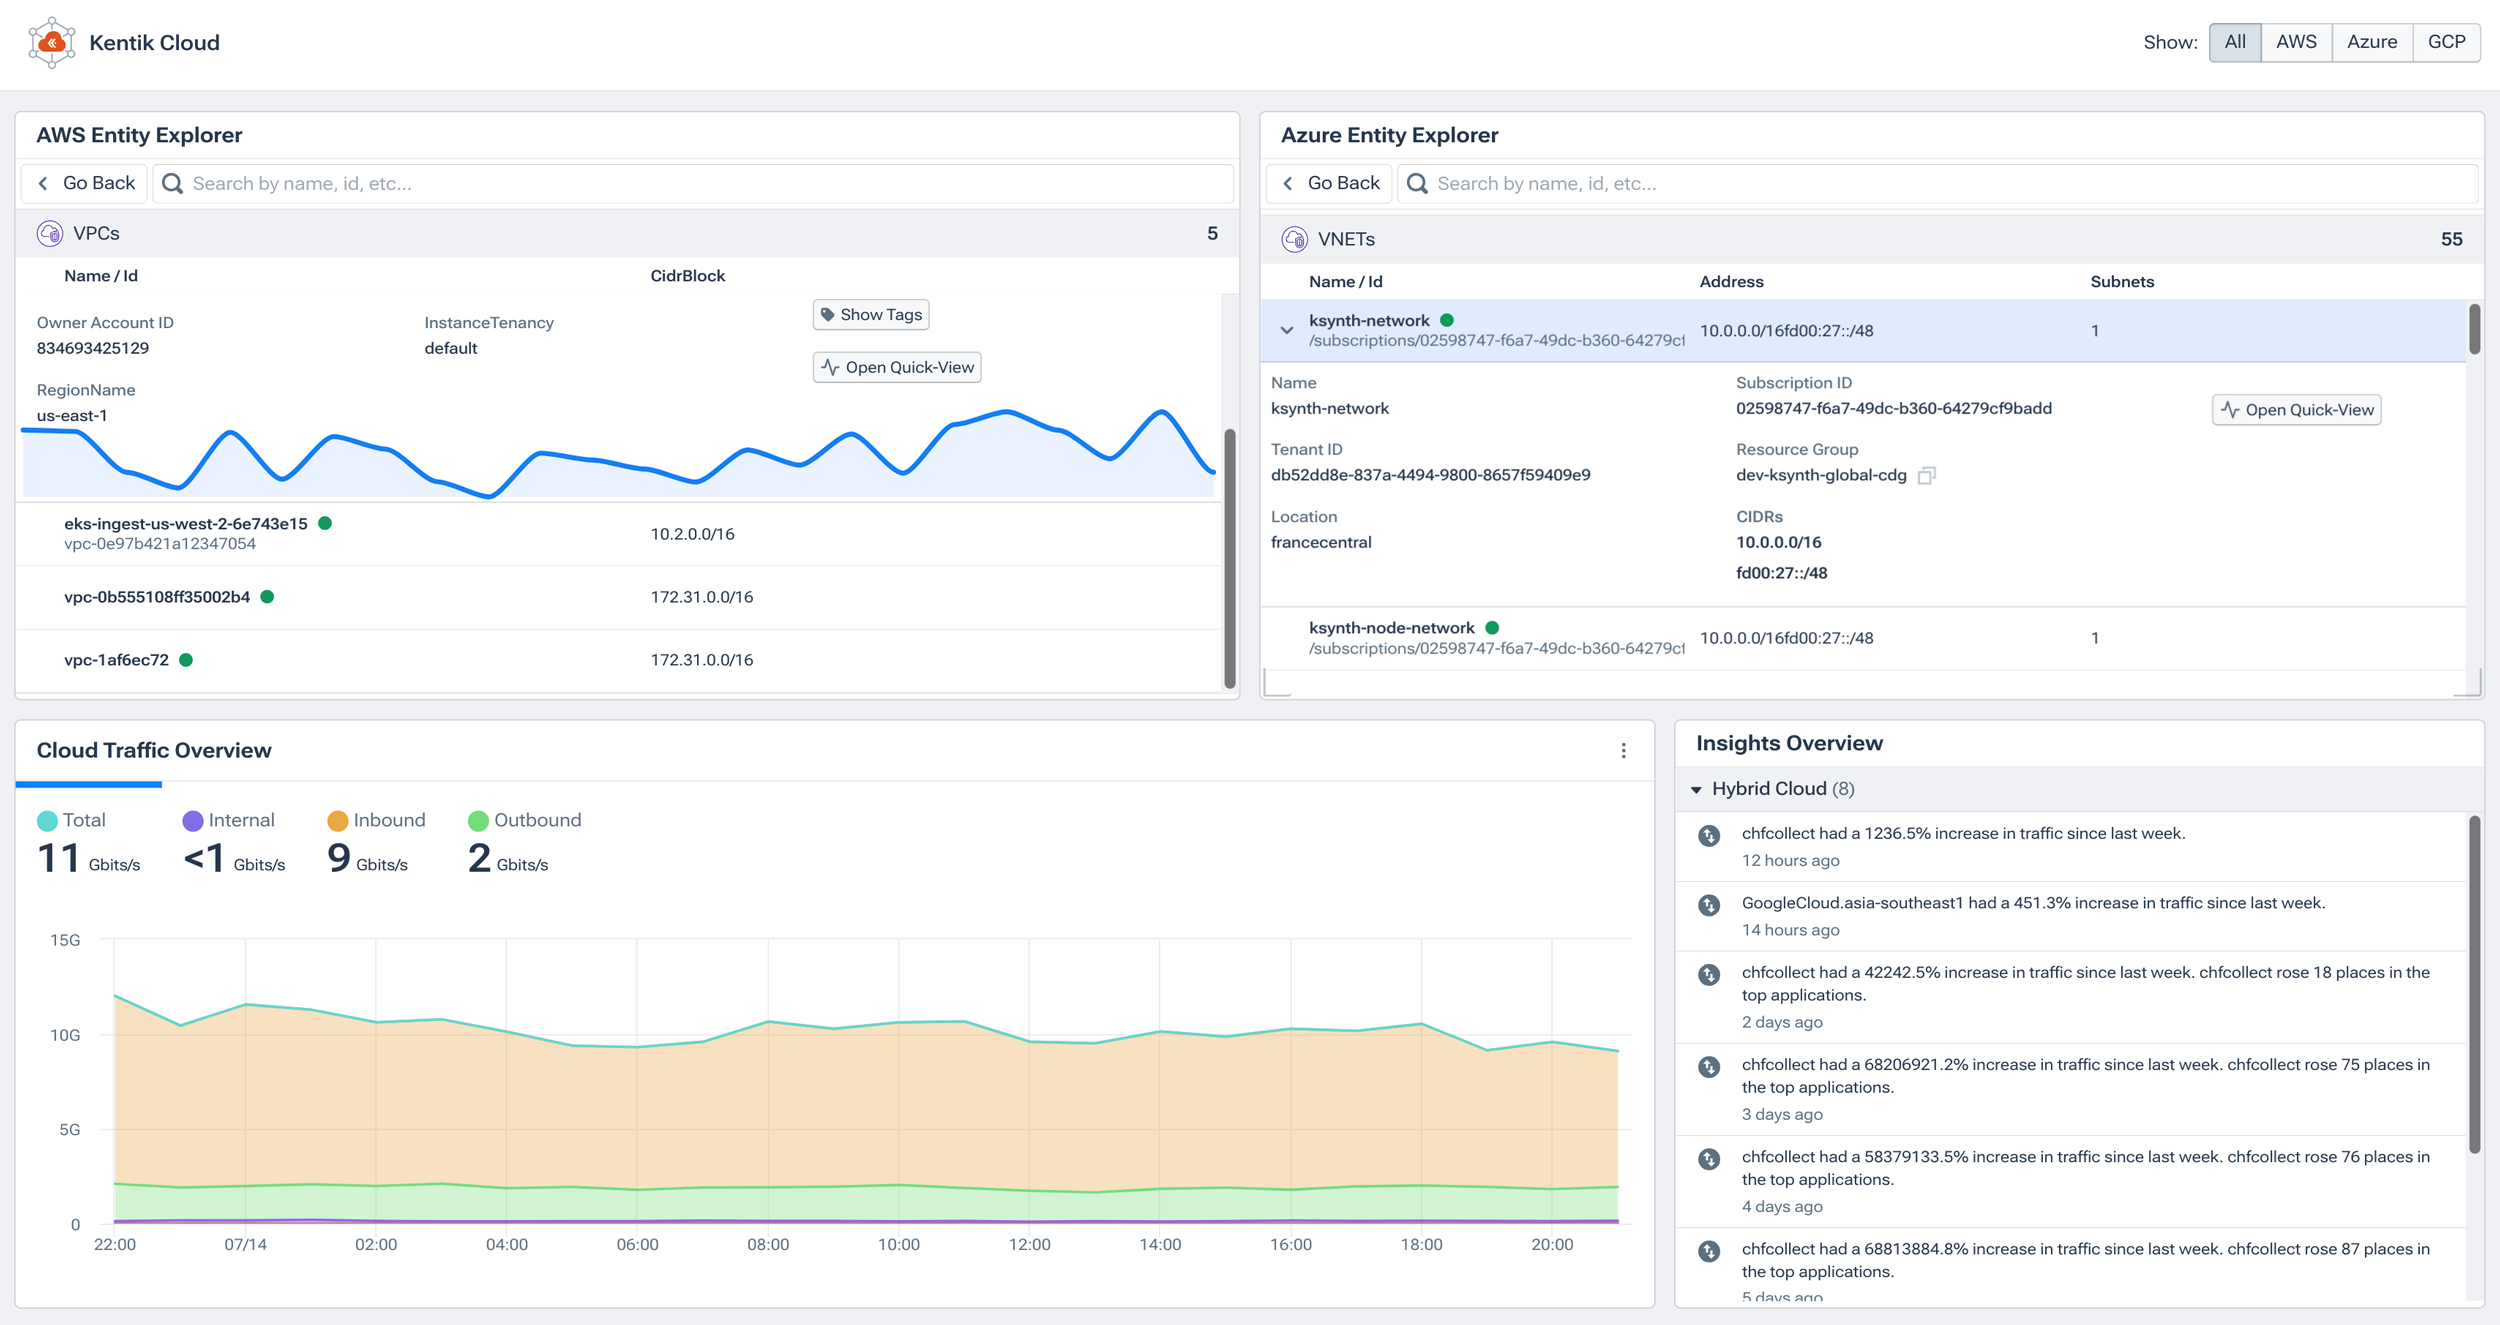
- Visualize hybrid cloud topology and traffic in one map
- Troubleshoot blocked connectivity and validate cloud traffic policy
- Example cloud & hybrid workflows
- FAQs about cloud & hybrid networking
1. Reduce cloud spend and attribute costs
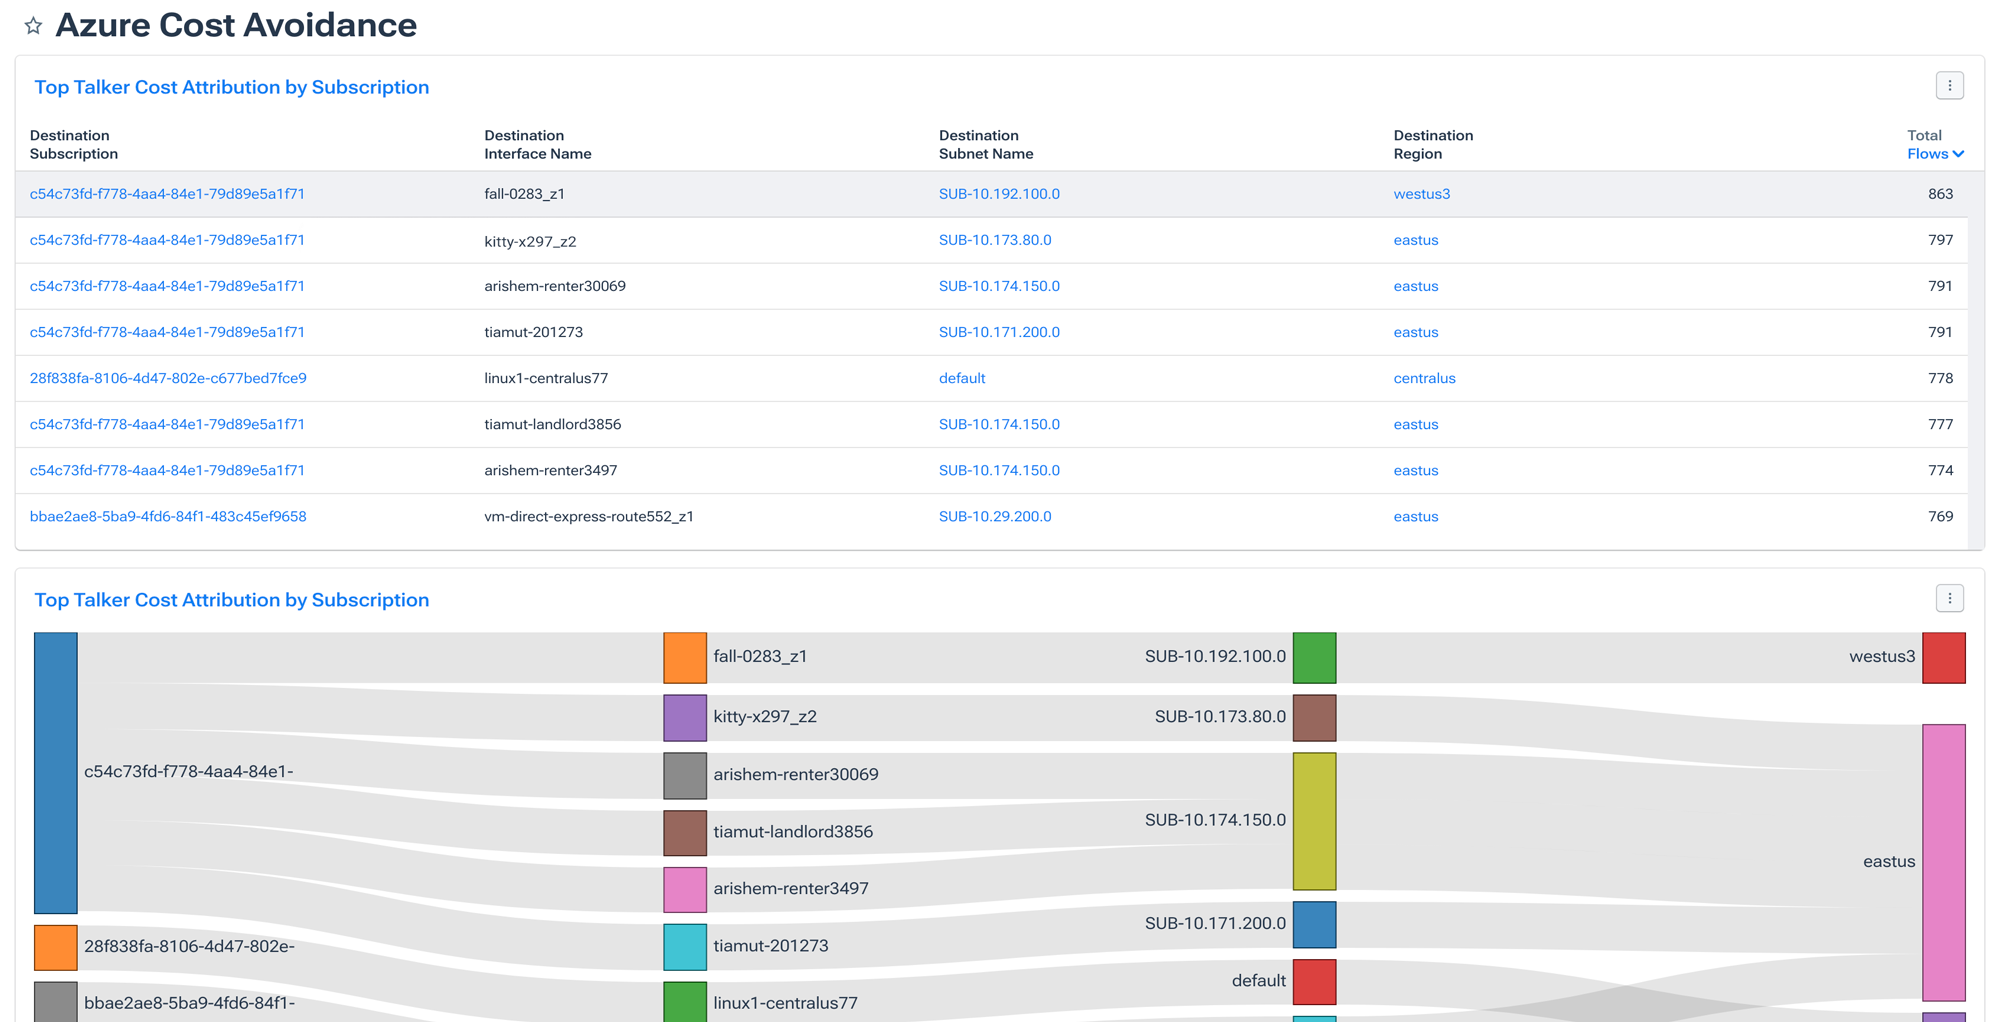
Cloud connectivity spend is usually a traffic problem wearing a finance hat. Kentik helps teams attribute cloud networking costs to the traffic and services causing them so they can reduce egress, right-size capacity, and avoid surprise bills.
Teams ask:
- Which accounts/subscriptions, VPCs/VNets, apps, and tags are driving egress and interconnect cost?
- What changed this week that made the bill spike?
- Are we paying for premium paths or oversized capacity that doesn’t improve user experience?
What you need to see:
- Traffic and topology context (cloud + on-prem + interconnect)
- Cost attribution linked to accounts/subscriptions/applications/tags
- Time-window trends that reveal what changed and when
How Kentik helps:
- Links connectivity costs to cloud accounts/subscriptions, applications, and tags so spend can be owned and optimized.
- Visualizes top cost drivers and trends with dashboards and topology-aware views.
- Connects cost to performance and dependency paths so teams can optimize without guessing.
Related solution page: Reduce Cloud Spend
2. Plan and execute cloud migrations with confidence
Kentik helps teams baseline dependencies, monitor migrations, and troubleshoot cutovers across data center, interconnects, and public cloud so migrations don’t become blind leaps.
Teams ask:
- What talks to this workload today, and what will break if we move it?
- Did latency, packet loss, or routing change after cutover?
- Is the bottleneck in cloud, on-prem, or the interconnect?
What you need to see:
- End-to-end topology and traffic (on-prem + cloud + interconnect + regions)
- Fast query and drilldown across traffic and infrastructure metrics
- Testing signals to validate experience during and after migration
How Kentik helps:
- Visualizes resources and connectivity between data centers, clouds, interconnects, and regions as a shared source of truth.
- Correlates traffic and metrics across routers/switches, VPC/VNet constructs, load balancers, and other components.
- Connects synthetic tests to real hybrid traffic so teams can validate performance during migrations and optimize after cutover.
Related solution page: Migrate To and From Any Cloud
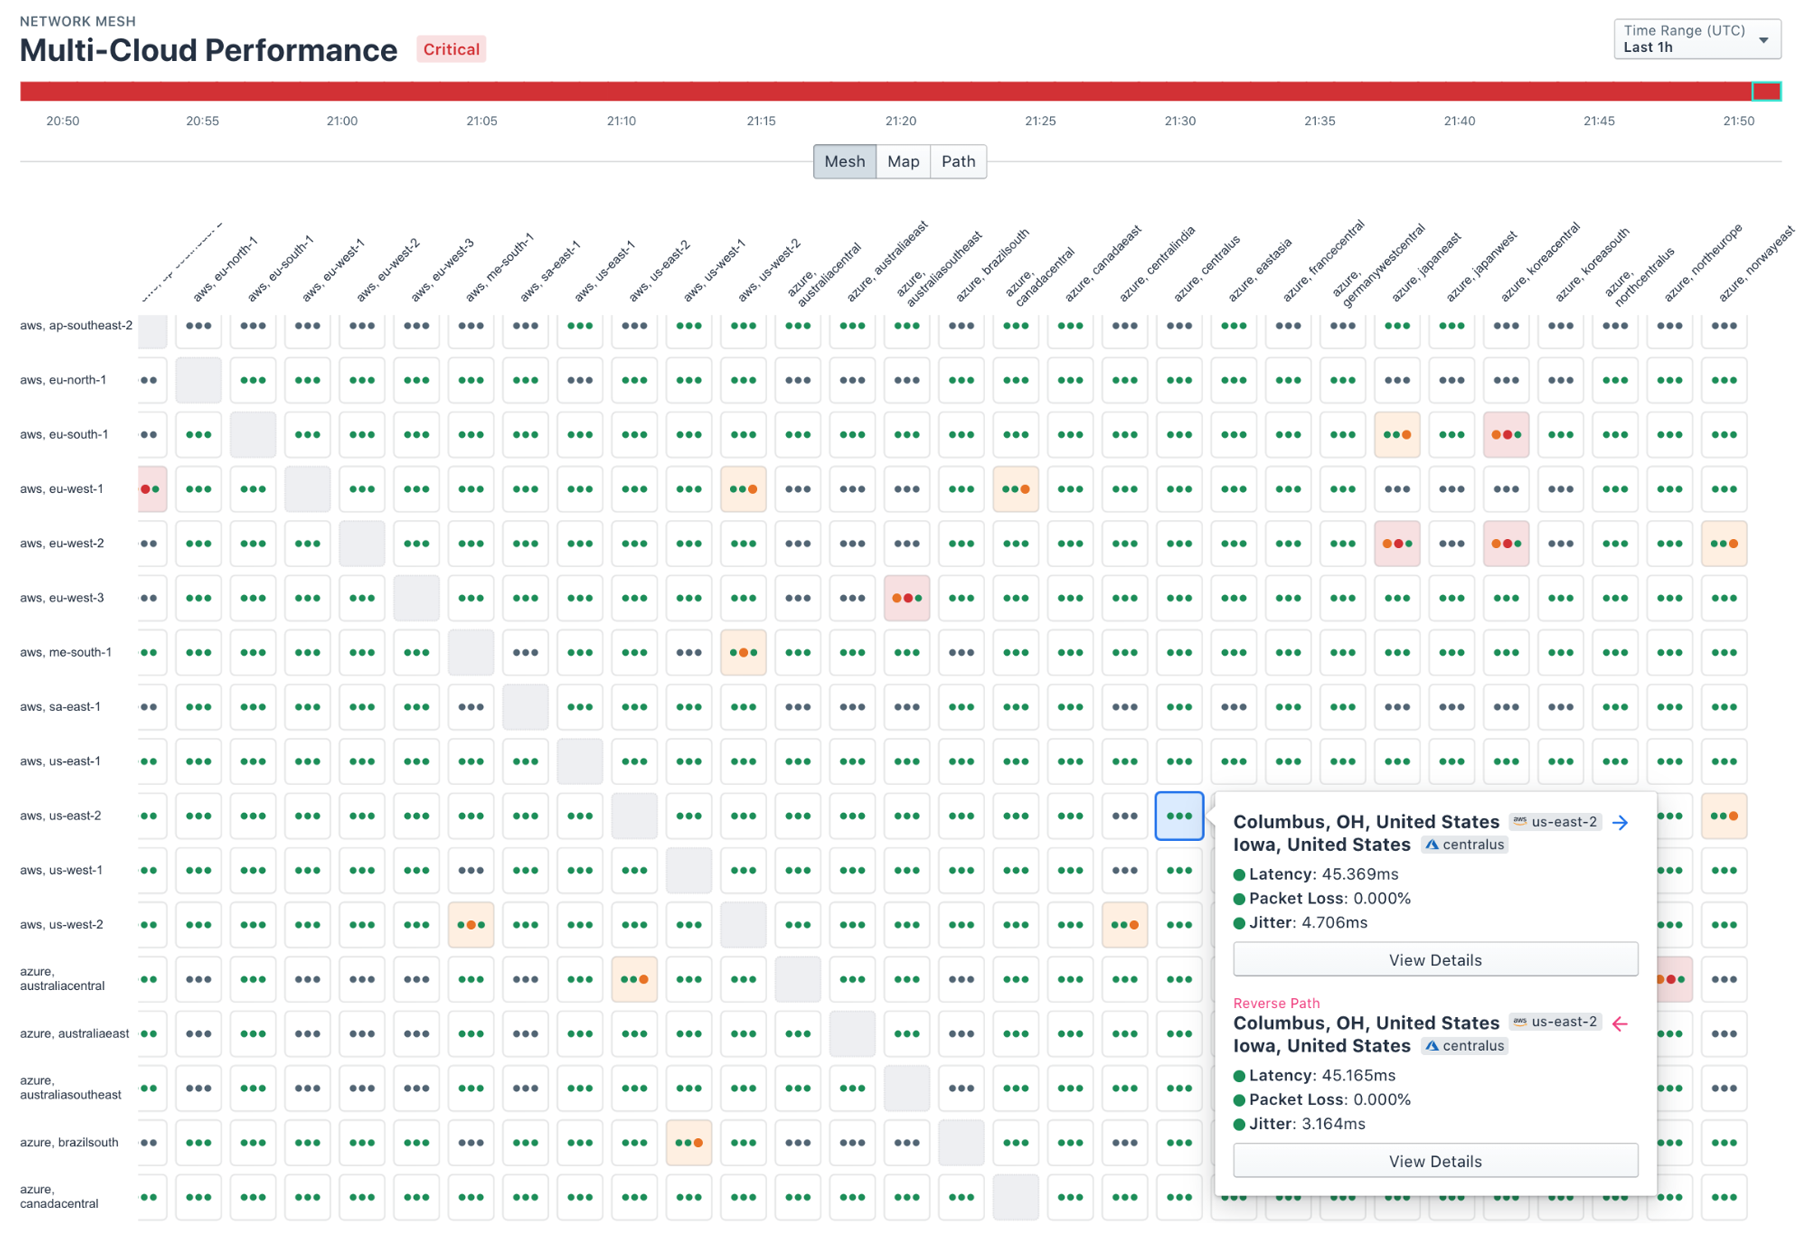
3. Improve multi-cloud performance and interconnect health
Kentik helps teams detect and fix multi-cloud performance problems by correlating interconnect telemetry, traffic behavior, and synthetic performance tests across critical paths.
Teams ask:
- Are Direct Connect, ExpressRoute, or Cloud Interconnect paths degraded?
- Which component is root cause: cloud edge, transit, region pair, or our network?
- How do we prioritize critical application traffic and prevent congestion or runout?
What you need to see:
- Interconnect performance signals and cloud metrics plus traffic context
- Synthetic tests for latency, loss, jitter, and path changes between key endpoints
- Time-window comparisons to isolate when degradation started and what changed
How Kentik helps:
- Identifies degraded connectivity across transit links and interconnect paths using cloud metrics and traffic context.
- Spots performance anomalies and bottlenecks in hybrid and multi-cloud traffic patterns.
- Uses synthetic testing and alerting to detect user experience degradation early and validate which segment is responsible.
Related solution page: Improve Cloud Performance
4. Visualize hybrid cloud topology and traffic in one map
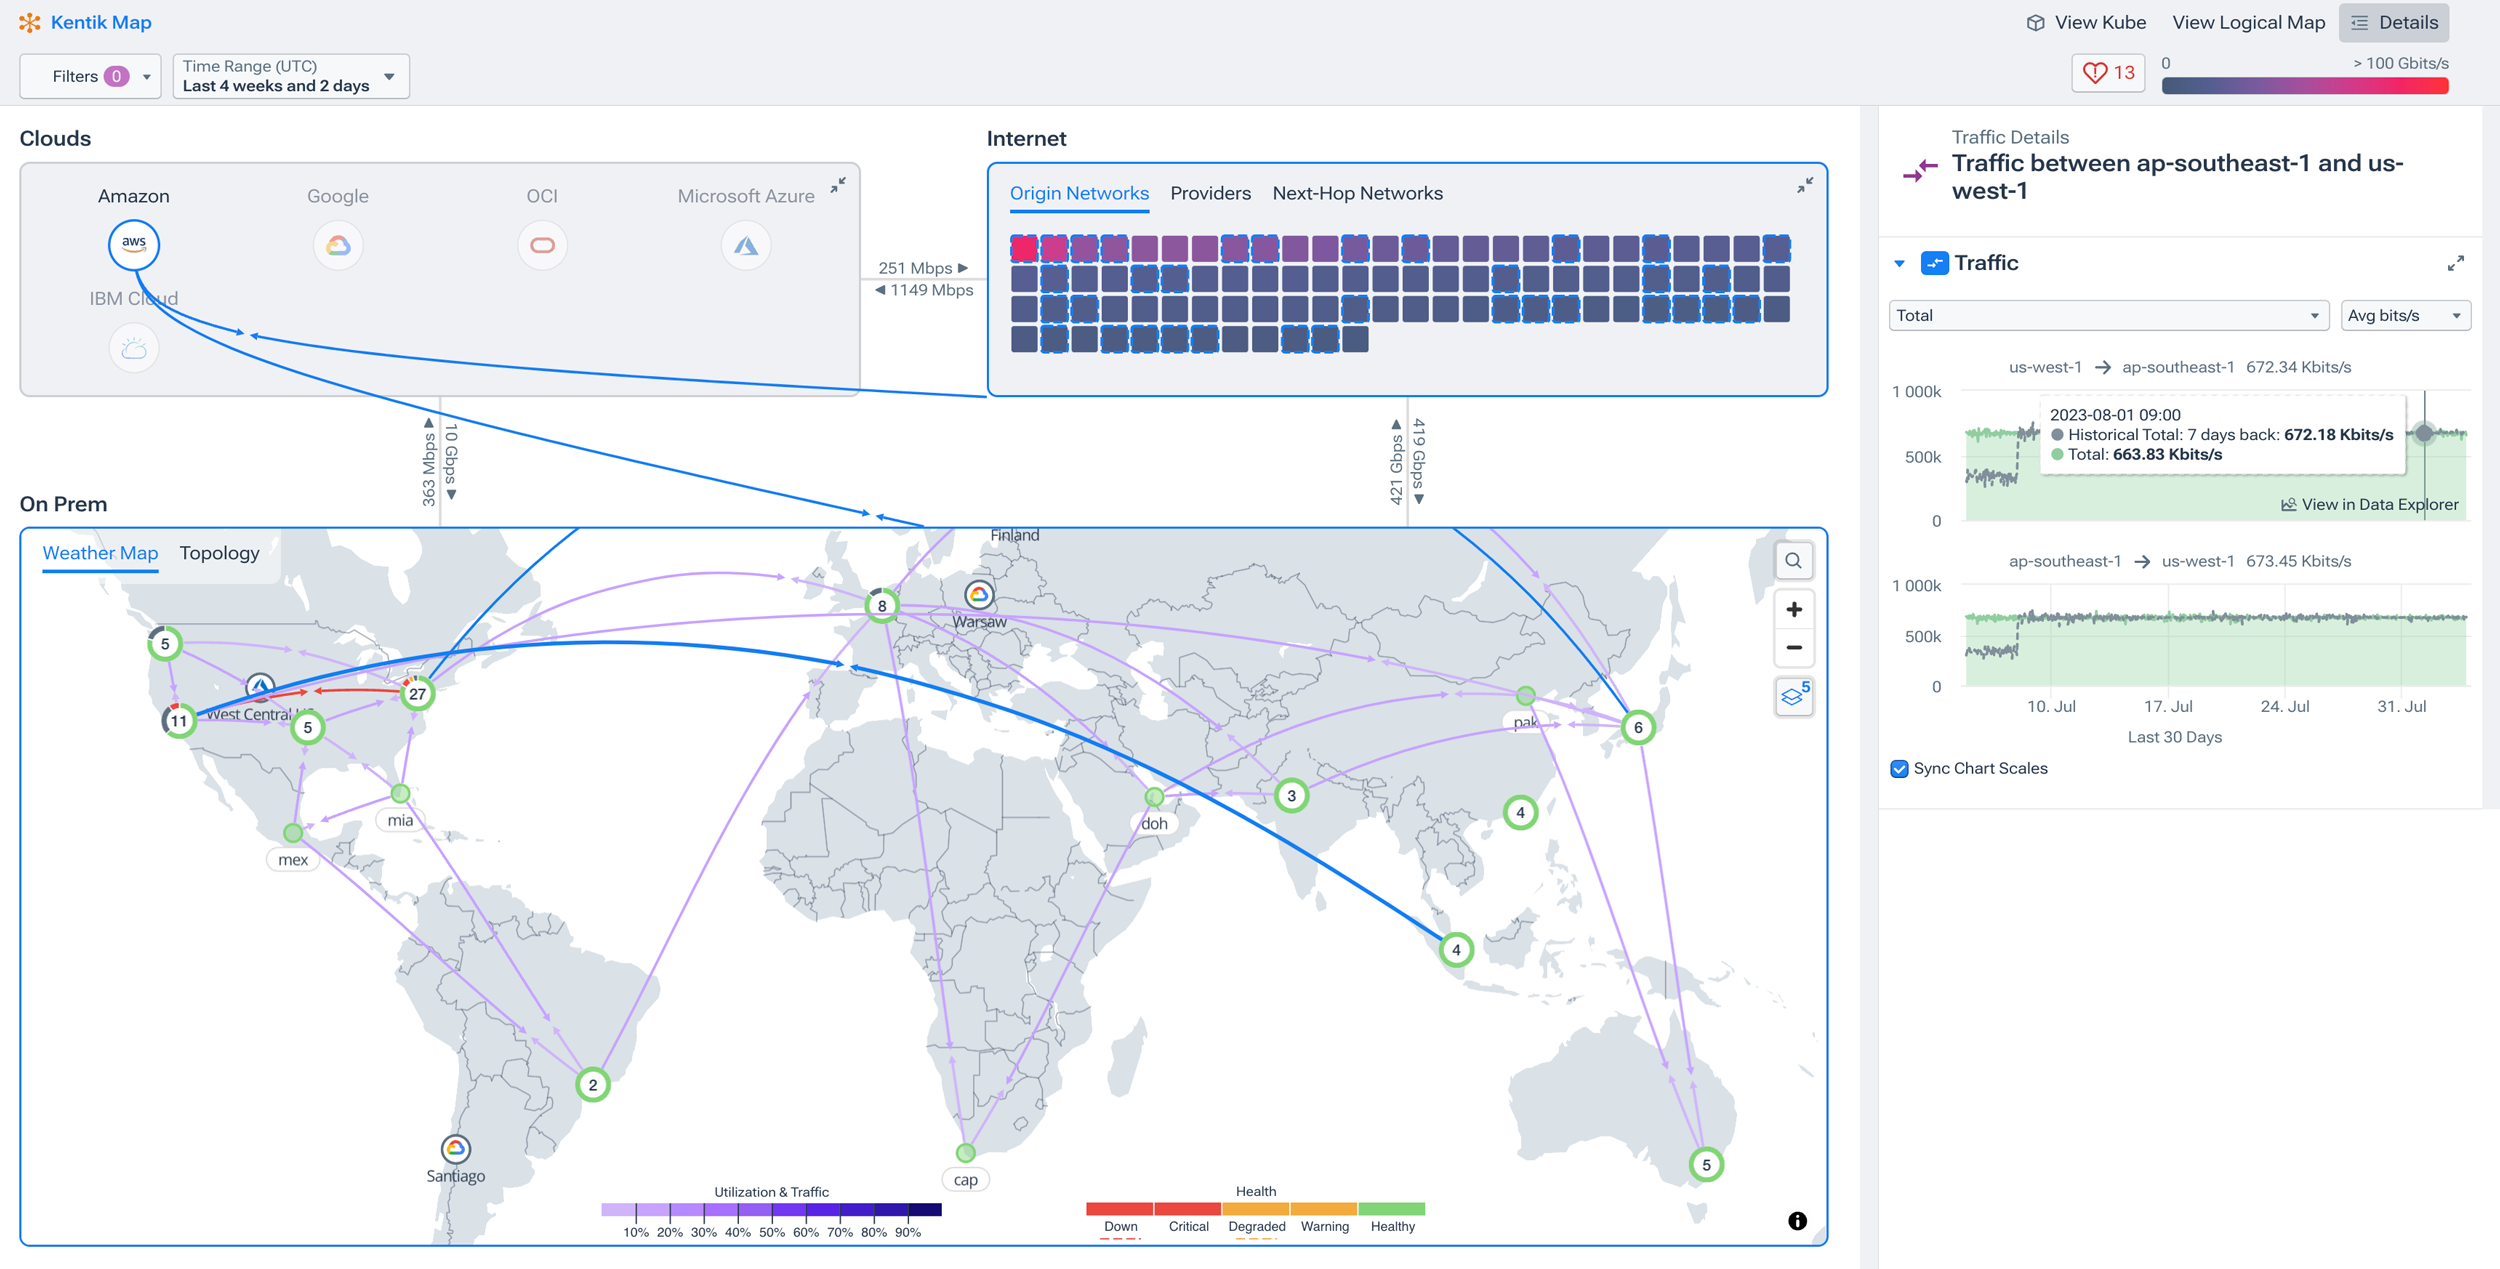
Kentik helps teams visualize hybrid and multi-cloud architecture and traffic with a live map that stays current as environments change, so troubleshooting and planning start from the same blueprint.
Teams ask:
- What is the real connectivity blueprint of our hybrid environment right now?
- How do VPCs/VNets, subnets, on-prem sites, and interconnects actually connect?
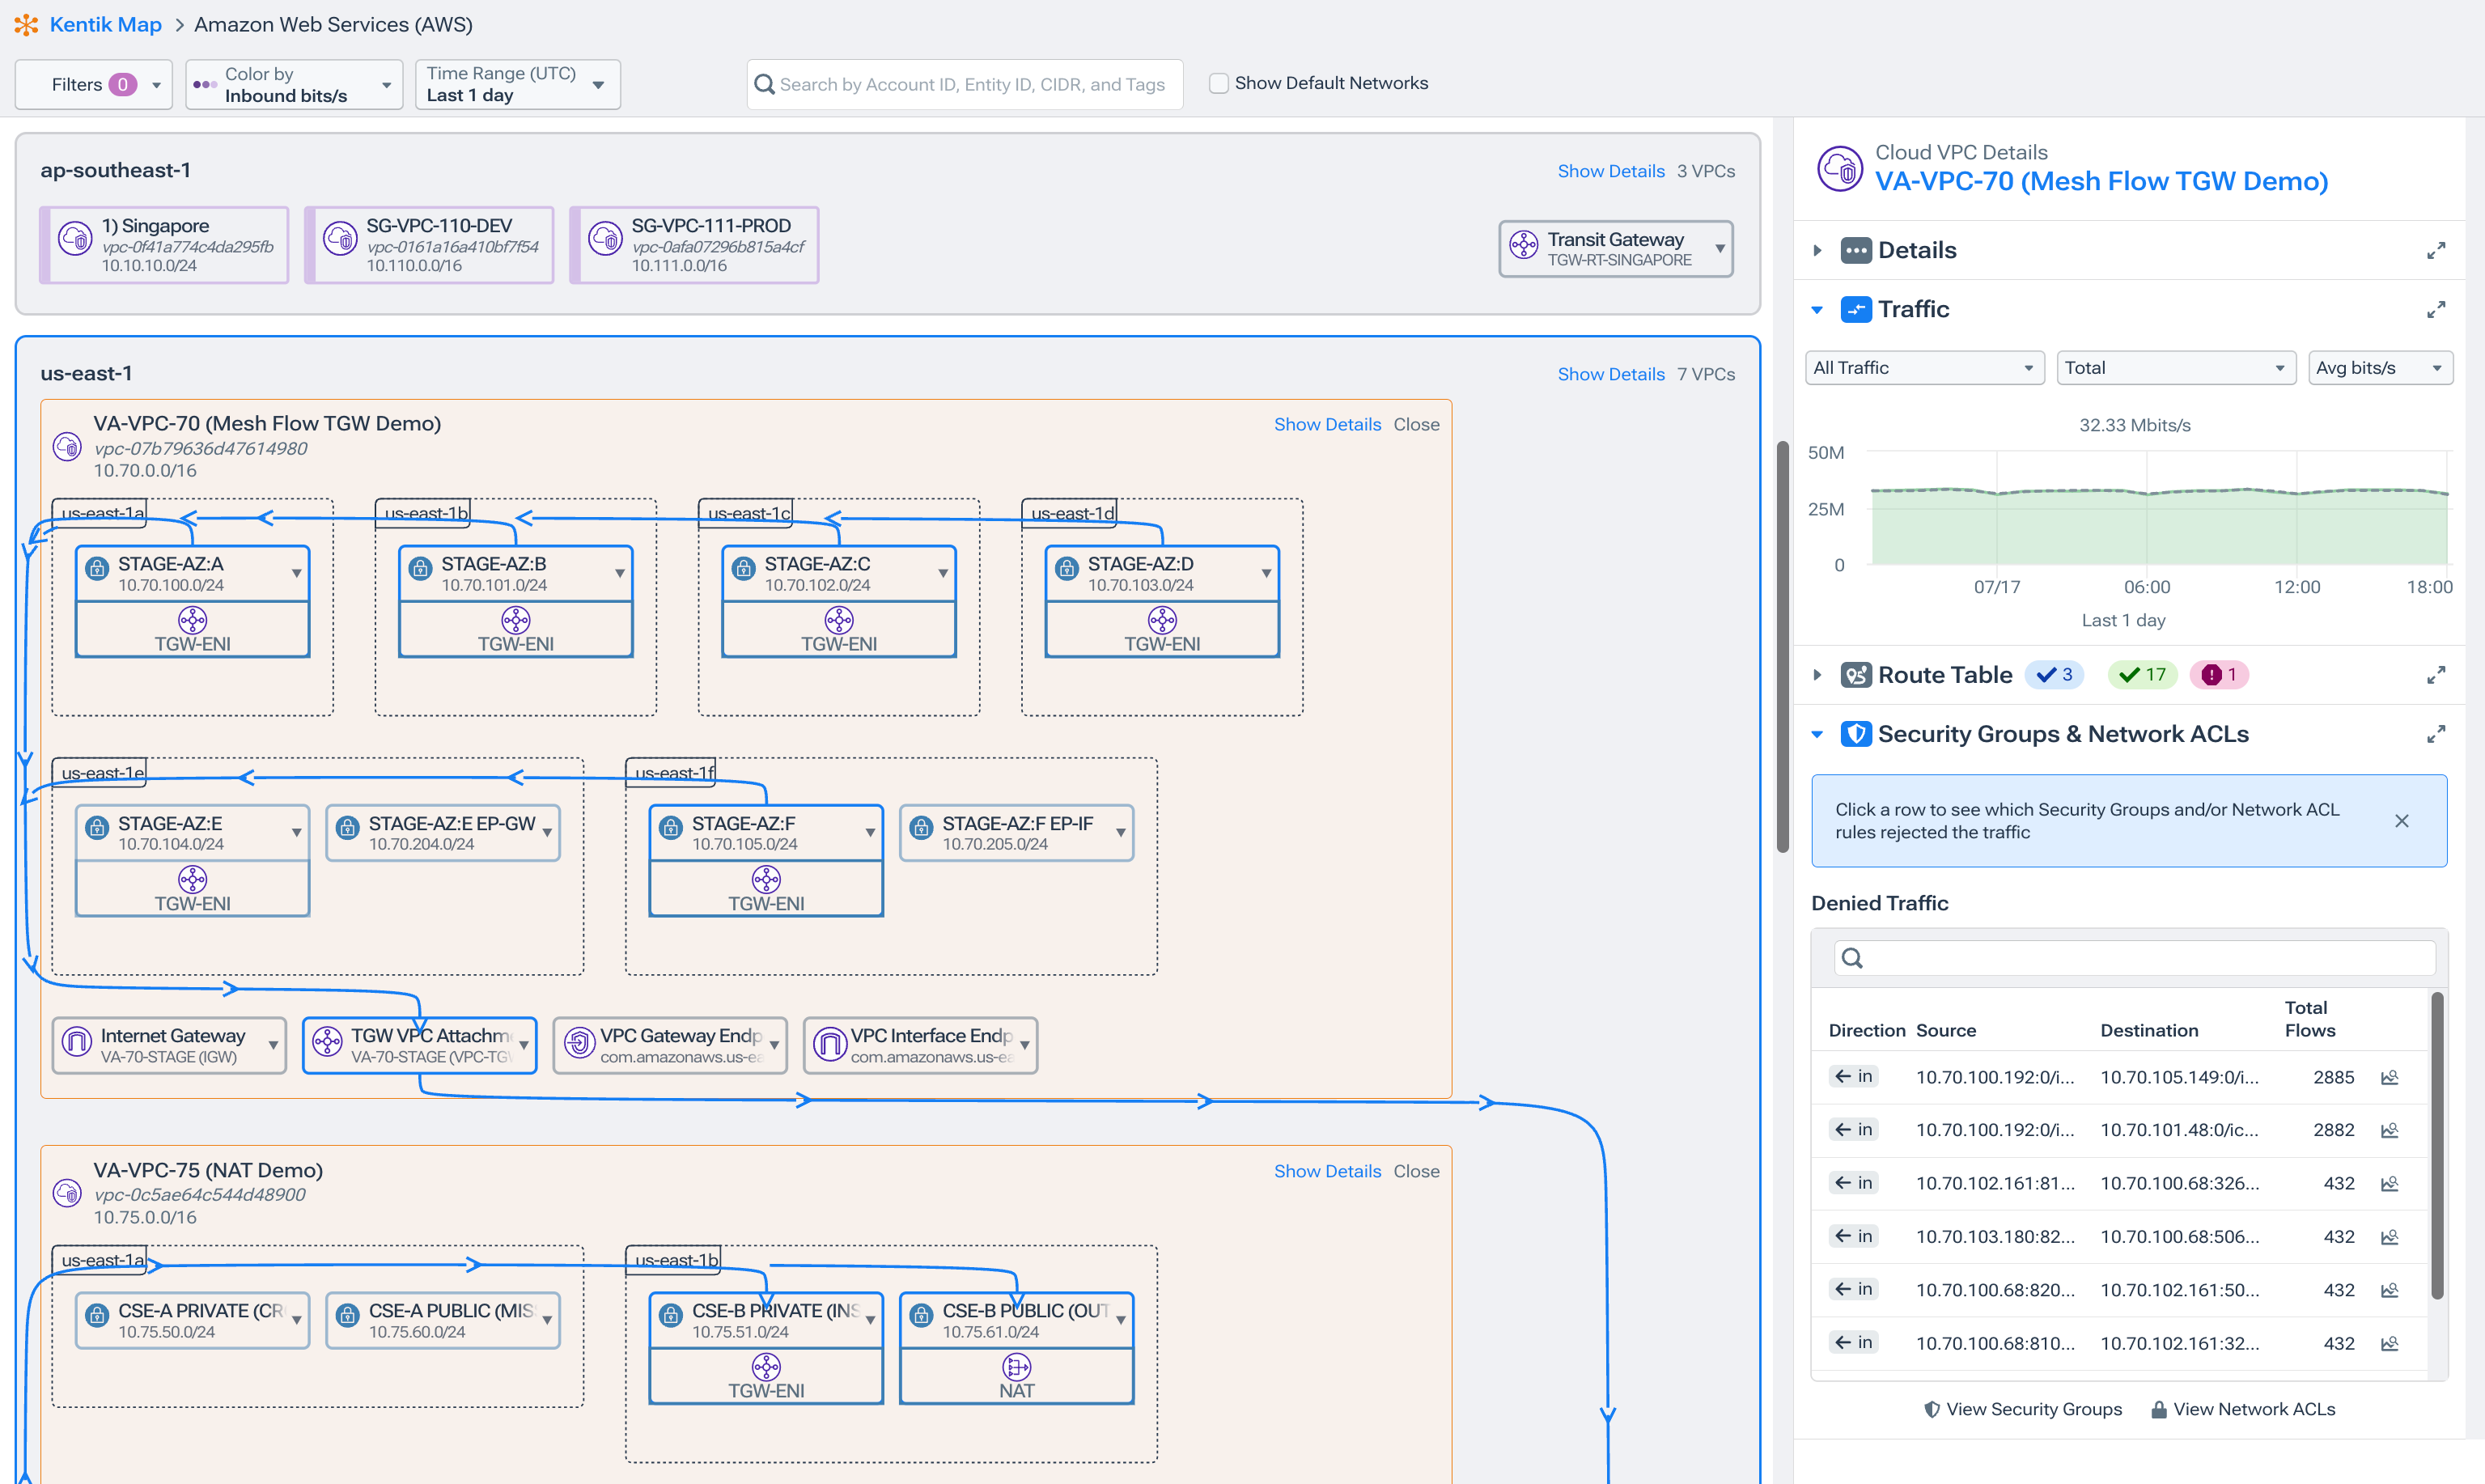
- Where does traffic flow, and what is allowed vs denied across cloud boundaries?
What you need to see:
- A topology view that includes clouds, regions, interconnects, and on-prem sites
- Utilization and performance data in context (not trapped in separate consoles)
- Visibility into denied vs allowed traffic for troubleshooting and audits
How Kentik helps:
- Provides live blueprints showing how resources nest and connect across on-prem and cloud.
- Lets teams investigate interconnect topology and drill into utilization and performance directly from the map.
- Shows allowed and denied traffic between VPCs/VNets, data centers, and the public internet to validate policy intent.
Related solution page: Visualize All Cloud and Network Traffic
5. Troubleshoot blocked connectivity and validate cloud traffic policy
Kentik helps teams pinpoint where connectivity is blocked and why by combining topology context, traffic signals, and targeted connectivity checks, so “why can’t it talk?” becomes answerable quickly.
Teams ask:
- Why can’t this workload talk to that service (VPC-to-VPC, VNet-to-on-prem, cross-region)?
- Which security group, ACL, firewall, or gateway is responsible for the block?
- Are we seeing unexpected cross-segment communication that violates policy intent?
What you need to see:
- A way to test connectivity between cloud objects with context
- Policy-relevant signals (allowed/denied) tied to the controls enforcing it
- A map of affected topology so investigations are fast and explainable
How Kentik helps:
- Provides on-demand connectivity checks between instances, subnets, and network interfaces with visibility into where connectivity breaks.
- Uses map-based context to tie blocked traffic to the relevant infrastructure and controls.
- Supports policy validation by making it easier to see and explain allowed vs denied traffic and unexpected paths.
Related product page: Complete Hybrid and Multi-Cloud Network Observability
Related solution page: Harden Network Policy Management
Example cloud & hybrid workflows (enterprise and service provider)
The sections above describe the core cloud and hybrid capabilities (cost attribution, migration visibility, interconnect performance, topology mapping, and policy troubleshooting). Below are practical examples showing how teams combine those capabilities in day-to-day operations.
Enterprise workflow examples
- “Why did cloud network cost spike?” attribution and optimization
When cloud bills jump, teams need to identify what changed, who owns it, and which fixes reduce spend without breaking performance.
- Attribute spend to accounts/subscriptions, apps, regions, and tags, then identify the traffic slices driving the spike.
- Compare “before vs after” time windows to confirm whether the change is new traffic, a routing shift, or an architectural move.
- Validate cost vs performance tradeoffs before making capacity or interconnect changes.
Related page: Reduce Cloud Spend
- “Will this migration break anything?” dependency baselining and cutover validation
Before cutover, teams need a dependency baseline. During cutover, they need confirmation that paths and experience are stable.
- Baseline who talks to the workload (sources, destinations, services, regions) and what “normal” looks like.
- Monitor the cutover window for latency/loss changes and routing shifts across cloud and interconnect segments.
- Validate experience after cutover using testing signals and real hybrid traffic.
Related page: Migrate To and From Any Cloud
- “Interconnect performance degraded” fast scoping and root cause isolation
When Direct Connect or ExpressRoute looks suspicious, teams need to isolate whether the issue is in cloud edge, transit, a region pair, or their network.
- Use synthetic tests to catch degradation early and pinpoint which endpoint pairs are affected.
- Correlate the degradation window with interconnect utilization, error signals, and traffic changes.
- Validate improvements after a routing or capacity adjustment.
Related page: Improve Cloud Performance
- “These two services can’t talk” connectivity and policy troubleshooting
Blocked connectivity should be diagnosable, not mystical.
- Run targeted connectivity checks to see where the path breaks.
- Use allowed/denied telemetry plus topology context to identify the control (security group, ACL/NSG, firewall, gateway) responsible.
- Document the evidence for change approval or audit.
Related page: Harden Network Policy Management
Multi-cloud visibility is a challenge for most IT teams juggling multiple tools and screens to understand application traffic across multiple public clouds. This short video explains how Kentik unifies telemetry from the major cloud providers and the public internet into one place to give you the ability to monitor and troubleshoot application performance across AWS, Azure, Google, and Oracle clouds for real-time and historical analysis.
Service provider workflow examples
- “Bring a new PoP online” performance validation and planning
When expanding into a new market, teams need proof that new capacity and interconnect decisions improve performance and don’t create hidden bottlenecks.
- Validate routing paths and reachability before announcing success.
- Track how traffic shifts as customers and OTT/CDN demand ramp.
- Use trends to plan capacity upgrades and prevent runout.
Related page: BGP Route Monitoring
- “M&A integration / network migration” shared visibility across two networks
During integration, teams need a single source of truth across both environments and clear evidence for post-cutover validation.
- Compare traffic and routing behavior before/during/after cutovers.
- Identify regressions quickly and stabilize service with fast investigation workflows.
- Produce evidence-backed summaries for internal and partner escalation.
Related page: Troubleshoot Any Network
In this short video, five network service providers explain why Kentik is essential for understanding traffic, controlling network cost, and planning for growth. Hear from Sorin Esanu (Race Communications), Michael Leclaire (MetroNet), John Lubeck (Midco), Wallace Lee (Imperva), and Everett Sinclair (Conway Corporation) on how they use Kentik to see “the bits on the wire,” dig deeper than traditional reporting tools, and turn network data into better customer experiences:
Across service provider and enterprise environments, Kentik helps teams optimize peering and CDN offload, sculpt traffic and caching strategy, automate DDoS mitigation, reduce transit spend even as traffic scales, automate capacity planning and finance reporting, and make network insights accessible beyond engineering. The result: faster decisions, measurable efficiency, and a platform customers say they can’t operate without.
Learn more about Kentik for Service Providers and about Kentik AI.
FAQs about cloud & hybrid networking
How do I attribute cloud networking spend to apps, accounts, and regions?
Start by correlating flow logs with account/subscription metadata and tags, then break down egress and interconnect traffic by service, region, and destination. The goal is to turn “a big bill” into a short list of traffic drivers you can own and optimize. Kentik supports this with automated cost attribution tied to cloud accounts/subscriptions, applications, and tags. See: Reduce Cloud Spend
What’s the fastest way to spot egress-heavy or unsanctioned (“shadow IT”) traffic patterns in cloud?
Look for sudden increases in outbound traffic to new destinations, then compare time windows to identify what changed (destination, service, region, account). Baseline first, then alert on new or unusual destinations. Kentik supports this with flow-log visibility across clouds and fast exploration by destination and service. See: Complete Hybrid and Multi-Cloud Network Observability
How do I validate hybrid and multi-cloud connectivity after a deployment or change?
Validate (1) routing and reachability, (2) performance between key endpoints, and (3) allowed/denied behavior for the relevant policy controls. The faster you can confirm those three, the faster you can rule the network in or out. Kentik supports this with topology context plus on-demand connectivity checks. See: Complete Hybrid and Multi-Cloud Network Observability
How do I troubleshoot denied traffic between VPCs/VNets, on-prem, and the internet?
Start with denied/allowed telemetry tied to the policy controls, then confirm the intended path in topology context. The goal is to identify the specific control causing the deny (security group, ACL/NSG, firewall, gateway), not just “it’s blocked.” Kentik supports this with denied-traffic workflows enriched with policy metadata. See: Harden Network Policy Management
How do I detect interconnect degradation (Direct Connect, ExpressRoute, Cloud Interconnect) before users notice?
Monitor utilization and key performance signals, then validate experience with synthetic tests between the same regions and endpoints users depend on. Catching it early is about measuring the path, not waiting for tickets. Kentik supports proactive detection with automated testing and cloud-informed visibility across interconnect paths. See: Improve Cloud Performance
What should I baseline before a cloud migration cutover?
Baseline dependencies (who talks to what) and key performance signals (latency, loss, throughput) on the current architecture, then compare the same paths and services after cutover. The baseline is your “receipt” for whether the move changed behavior. Kentik supports before/during/after migration visibility across data center, interconnects, and cloud. See: Migrate To and From Any Cloud
How can I visualize hybrid cloud topology and traffic in one place?
Use a live topology map that includes cloud regions, VPCs/VNets, subnets, interconnects, and on-prem sites, then overlay traffic and health so you can troubleshoot and plan from one blueprint. Kentik supports this with live blueprints and topology-aware exploration. See: Visualize All Cloud and Network Traffic
How do I reduce cloud networking cost without guessing at architecture changes?
Combine cost attribution (who/what is driving spend) with performance context (what the traffic supports) so right-sizing and path changes don’t cause regressions. Optimize the traffic drivers first, then adjust connectivity and architecture with evidence. Kentik supports cost-vs-performance decisions by linking connectivity cost to traffic behavior and dependency paths. See: Reduce Cloud Spend
How do service providers prove a migration changed customer experience?
Correlate the migration window with changes in paths, traffic distribution, and performance signals, then document “before vs after” evidence for internal teams and partner escalations. Kentik supports this by combining path visibility with testing signals to validate experience changes. See: Deliver Exceptional Digital Experiences

