Network Performance Monitoring Metrics
Network performance monitoring (NPM) refers to the process of measuring, diagnosing, and optimizing the service quality of a network as experienced by users. NPM is complementary to application performance management (APM). Network performance monitoring (NPM) is critical to managing and maintaining a network’s overall health, stability, and efficiency. It involves the continuous measurement, analysis, and optimization of various network parameters to ensure that users experience seamless connectivity and optimal performance.
By employing NPM strategies and leveraging key metrics, network administrators can proactively identify bottlenecks, troubleshoot performance issues, and optimize resources to deliver a high-quality user experience across the entire network ecosystem.
What are Network Performance Monitoring Metrics?
Network performance monitoring (NPM) metrics are quantitative indicators used to assess a network’s efficiency, reliability, and performance. These metrics provide network administrators with valuable insights into the health and functionality of the network infrastructure, helping them identify potential issues, optimize resources, and maintain a high-quality user experience.

Typical NPM Metrics
Network performance monitoring addresses the network and the internet’s role in the end-user experience. Typical NPM metrics include::
- Latency: How much time it takes to get a response to a packet. This is measured bi-directionally. One direction of measurement looks at when a local host, such as an application or load-balancing server (like HAProxy or NGINX), sends a packet to a remote host and times how long it takes to get a response back. The other direction looks at when a packet is received from a remote host and measures how long it takes for the application (server) to send a response.
- Number and percent of out-of-order packets: This is an important measure because TCP can’t pass data up to applications until bytes are in the right order. Small numbers of out-of-order packets typically don’t affect things much, but when they get too high, they will impact application performance.
- TCP retransmits: When a portion of a network path is overloaded or has performance problems, it may drop packets. TCP ensures the delivery of data by using ACKs to signal that data has been received. If a sender doesn’t get a timely ACK from the receiver, it will resend a packet with the unacknowledged TCP segment. When TCP retransmits go over very low single-digit percentage levels, application performance starts to degrade.

Enhanced Network Monitoring Metrics Enabled in Kentik
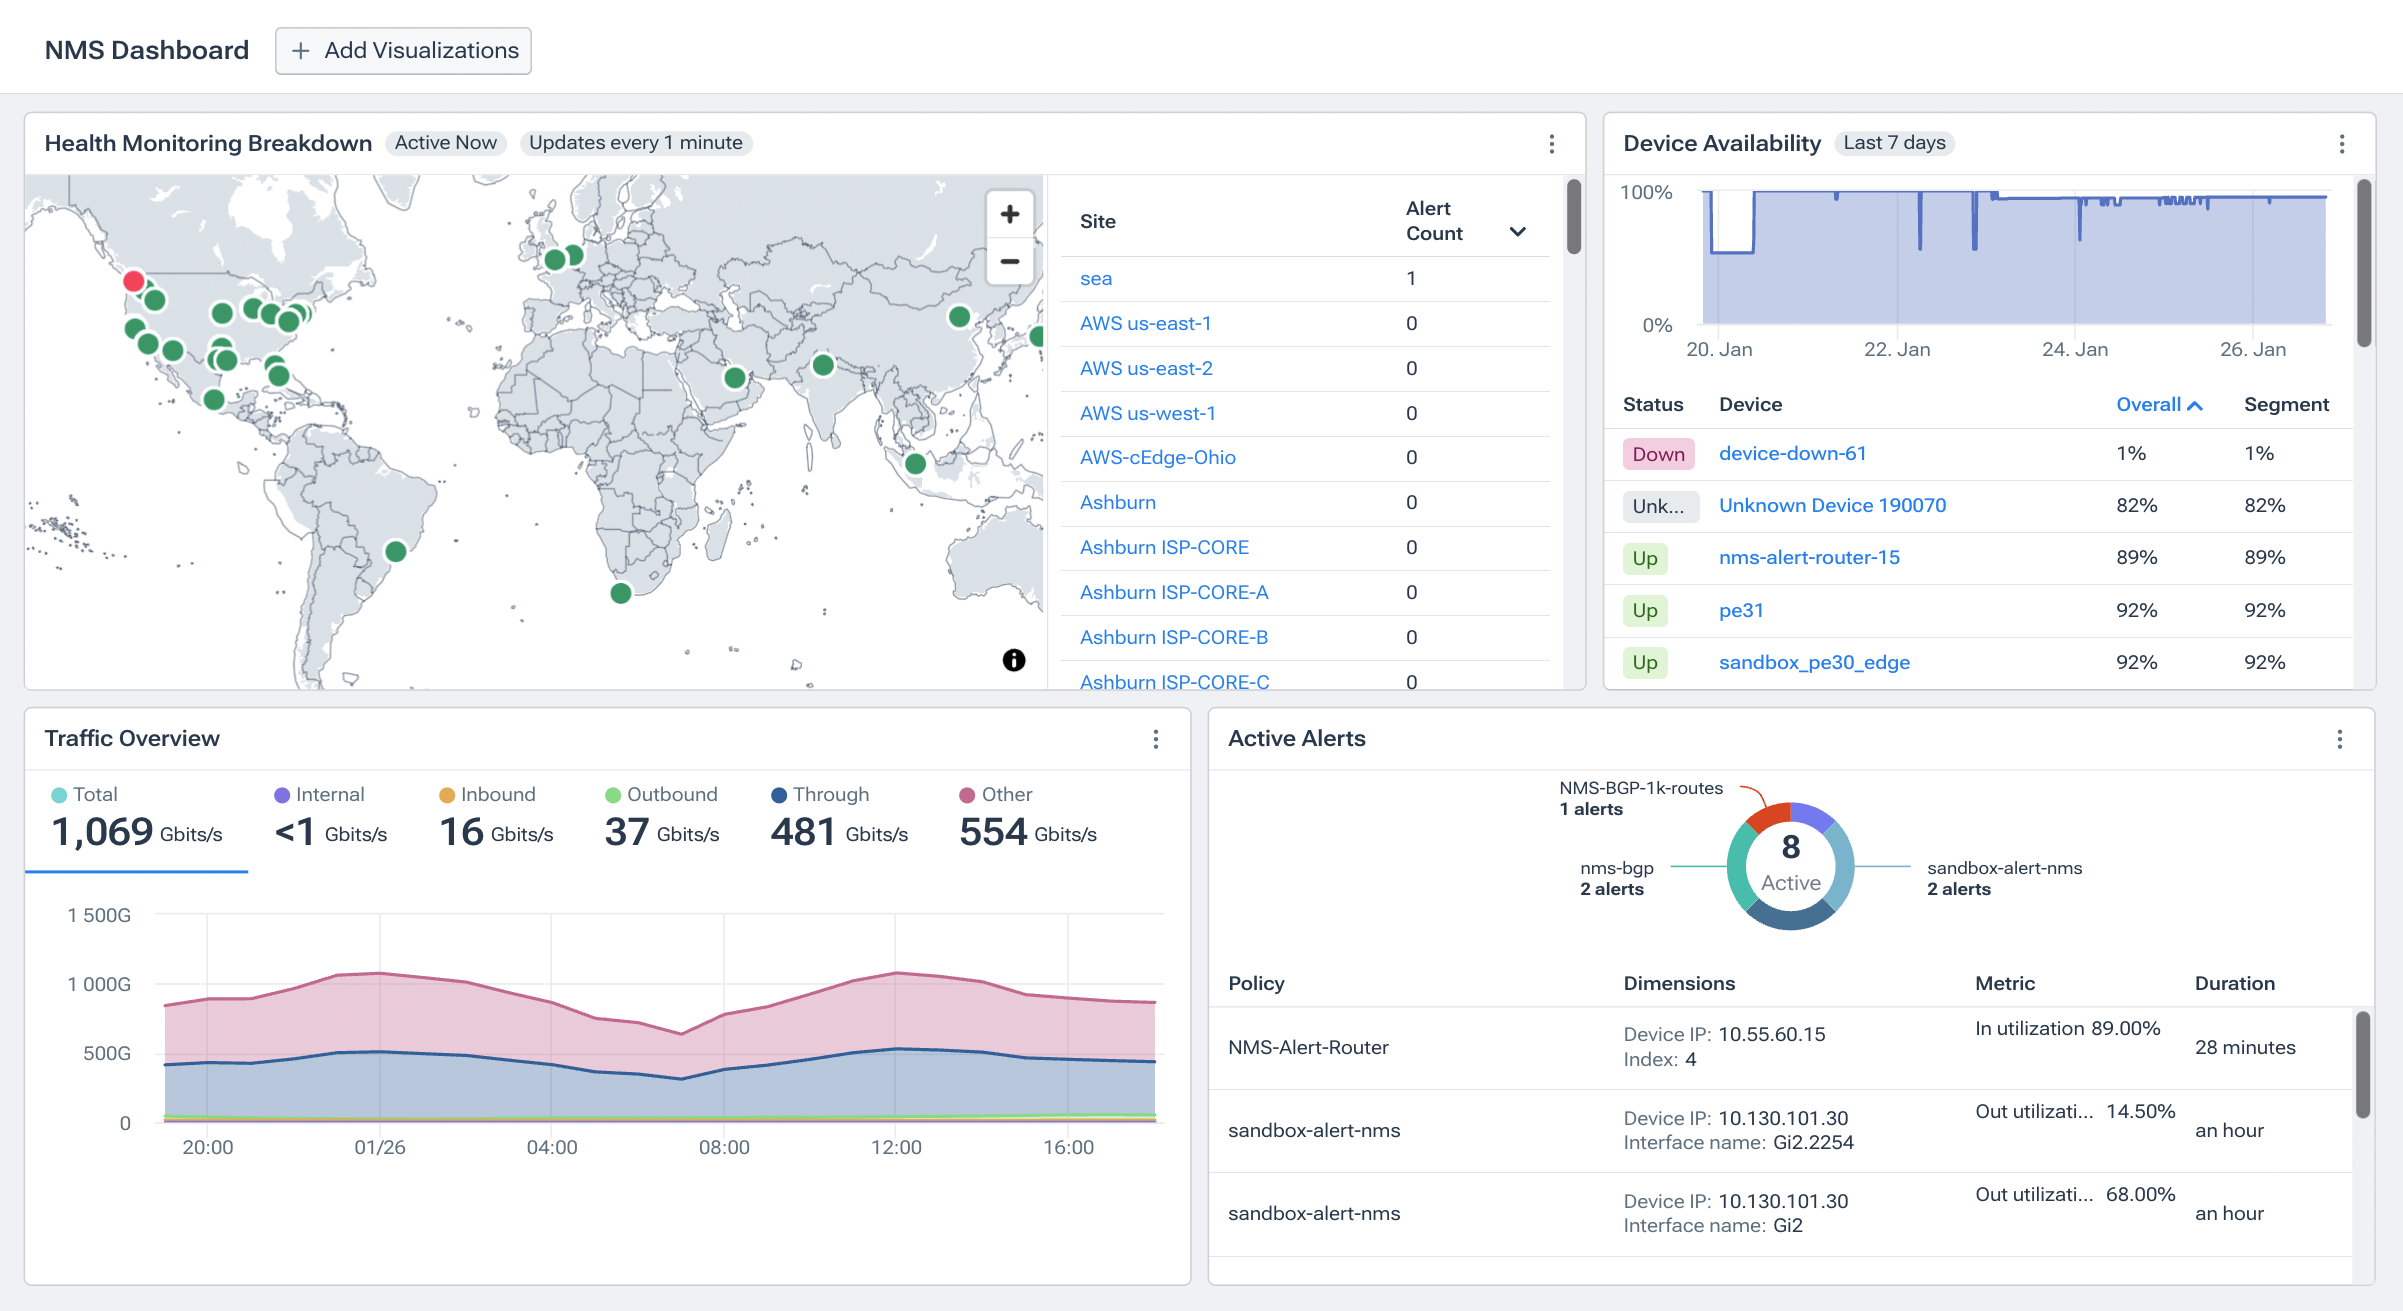
Network performance monitoring (NPM) is crucial for maintaining optimal service quality and user experience. With Kentik’s enhanced network monitoring metrics, NetOps teams can gain deeper insights into network performance through SNMP, streaming telemetry, network flow protocols, and host- and application-level metrics. These metrics allow users to make data-driven decisions to improve a network’s efficiency and effectiveness.
SNMP Metrics
Simple Network Management Protocol (SNMP) is an industry-standard protocol used for monitoring and managing devices in IP networks. Kentik’s advanced SNMP metrics collection enables organizations to enrich their network data with SNMP-derived metrics that provide a comprehensive understanding of their networks’ performance. Some of the key SNMP metrics Kentik offers include:
SNMP Interface Metrics including:
- Bit Rate: Measures the rate of bits received and transmitted on an interface, including framing characters.
- Packets: The rate of unicast packets received and transmitted, including discards.
- Errors: The number of inbound and outbound packets containing errors that prevent delivery or transmission.
- Discards: The number of inbound and outbound packets discarded without error detection, often to free up buffer space.
- Multicast Packets: The number of inbound and outbound packets addressed to a multicast address.
- Broadcast Packets: The number of inbound and outbound packets addressed to a broadcast address.
Network Device Metrics including:
- CPU Utilization: The percentage of CPU utilization for a specific component within a device.
- Memory Total, Used, Free, and Utilization: These metrics provide insight into a device component’s memory allocation, usage, and availability.
The definitive guide to running a healthy, secure, high-performance network

Streaming Telemetry Metrics
Kentik also supports streaming telemetry metrics for routers that support streaming telemetry publishing. These metrics allow for real-time network monitoring and provide additional visibility into a network’s performance. In Kentik, streaming telemetry metrics share the same names as their SNMP counterparts but are displayed separately.
Flow Protocol Metrics
Kentik also monitors and measures metrics transmitted via network flow protocols (such as NetFlow, sFlow, and IPFIX). These metrics provide a high-level view of network performance and can include the following:
- Bits per second: Measures the data transmission speed in the network.
- Packets per second: Evaluates the rate at which packets are transmitted.
- Flows per second: Monitors the number of active flows within a specified time frame.
- Unique source and destination IPs: Counts the distinct IP addresses involved in network communication.
- Unique route prefixes, ports, and ASNs: Analyzes the diversity of network routes, ports, and Autonomous System Numbers.
- Unique countries, regions, and cities: Provides a geographic perspective on network traffic.
Host Traffic Metrics
Host traffic metrics focus on the performance of individual devices within the network, such as routers, switches, and servers. Some examples of host traffic metrics are:
- Retransmits: Measures the number of packets that are resent due to network delivery issues.
- Out-of-order packets: Evaluates the number of packets arriving at their destination out of sequence.
- Fragments: Monitors the number of packets that have been split into smaller packets for transmission.
- Zero Windows: Counts the instances of TCP receive windows with a value of zero, indicating a full buffer.
- Receive Window: Assesses the size of the TCP receive window.
- Latency: Quantifies the time delay experienced in network communication.
Application Decodes Metrics
Application decodes metrics focus on the performance of network applications and services. They are generated when a host agent is used for application decodes, such as with Kentik’s kprobe agent. Some examples of application decodes metrics include:
- Connection Name: Identifies a specific TCP connection.
- Application Latency: Measures one-way network latency derived by examining request/response pairs at the application layer.
- First Payload Exchange (FPEX) Latency: Calculates the elapsed time from the first packet sent to the first packet returned.

Network Performance Monitoring Deployment Models
NPM solutions have traditionally utilized an appliance deployment model. An appliance-based PCAP probe with one or more interfaces connects to router or switch span ports or to an intervening packet broker device (such as those offered by Gigamon or Ixia). The appliance records all packets passing across the span port into memory and then into longer-term storage. In virtualized data centers, virtual probes may be used, but they are also dependent on network links in one form or another.
Physical and virtual appliances are costly from a hardware and (in the case of commercial solutions) software licensing point of view. As a result, in most cases, it is only fiscally feasible to deploy PCAP probes to a few selected points in the network. In addition, the appliance deployment model was developed based on pre-cloud assumptions of centralized data centers holding relatively monolithic application instances. As cloud and distributed application models have proliferated, the appliance model for packet capture is less feasible because, in many cloud hosting environments, there is no way to even deploy a virtual appliance.
A cloud-friendly and highly scalable SaaS model for network performance monitoring splits the monitoring function from the storage and analysis functions. Monitoring is accomplished with the deployment of lightweight monitoring software agents that export PCAP-based statistics gathered on servers and open-source proxy servers such as HAProxy and NGNIX. Exported statistics are sent to a SaaS repository that scales horizontally to store unsummarized data and provides big data-based analytics for alerting, diagnostics, and other use cases. While host-based performance metric export doesn’t provide the full granularity of raw PCAP, it provides a highly scalable and cost-effective method for ubiquitously gathering, retaining, and analyzing key performance data, thus complementing PCAP.
About Kentik Network Performance Monitoring Solutions
Kentik offers a suite of advanced network monitoring solutions designed for today’s complex, multicloud network environments. The Kentik Network Observability Platform empowers network pros to monitor, run and troubleshoot all of their networks, from on-premises to the cloud. Kentik’s network monitoring solution addresses all three pillars of modern network monitoring, delivering visibility into network flow, powerful synthetic testing capabilities, and Kentik NMS, the next-generation network performance monitoring system.
To see how Kentik can bring the benefits of network observability to your organization, request a demo or sign up for a free trial today.
Kentik’s comprehensive network performance monitoring solution delivers:
- Deep Internet Insights: Enables visibility into the performance, uptime, and connectivity of widely-used SaaS applications, clouds, and services.
- Intelligent Automation: Offers valuable insights without overwhelming users with unnecessary alerts.
- Comprehensive Data Understanding: Integrates SNMP, streaming telemetry, traffic flows, VPC logs, host agents, and synthetic monitoring for a holistic view of network performance.
- Multi-cloud Performance Monitoring: Monitors network traffic performance across hybrid and multi-cloud environments.
- Rapid Troubleshooting: Kentik’s network map visualizations enable swift issue isolation and resolution.
- Proactive Quality of Experience Monitoring: Optimizes application performance and detects potential issues in advance.
- Enhanced Collaboration Features: Promotes seamless coordination across network, cloud, and security teams through robust integrations.
- Advanced AI Features: Kentik AI allows NetOps professionals and non-experts alike to ask questions—and immediately get answers—about the current status or historical performance of their networks using natural language queries.


