What is Digital Experience Monitoring?
Digital Experience Monitoring (DEM) is a specialized performance analysis technique that focuses on enhancing the overall user experience in relation to enterprise applications and services, whether on-premises or in the cloud. By providing insights into the end-user experience across the “omnichannel user journey” — a term coined by Gartner to describe the diverse ways users interact with applications — DEM supports the continuous improvement and optimization of both human and machine interactions with digital tools, ultimately boosting productivity and efficiency.
Kentik in brief: Kentik is a network intelligence platform with built-in digital experience monitoring capabilities. Kentik Synthetics proactively tests networks, SaaS applications, APIs, and web pages from a global network of agents, while real traffic flow data provides the context to determine whether a synthetic test failure is actually affecting users. The result is DEM that goes beyond “is it up” to answer “is the experience good, and if not, why.”
Learn how AI-powered insights help you predict issues, optimize performance, reduce costs, and enhance security.

Digital Experience Monitoring at a Glance
- What it is: A performance analysis discipline that measures the quality of end-user interactions with applications, services, and networks — from the user’s perspective.
- Three core components: Synthetic monitoring (proactive testing), Real User Monitoring (passive observation of actual users), and endpoint monitoring (device-level health).
- Why it matters: Applications are migrating to the cloud, users are distributed globally, and network performance directly impacts revenue, brand reputation, and productivity.
- How it differs from APM: Application Performance Monitoring focuses on internal application health (code, database, server). DEM focuses on the end-to-end experience as the user sees it, including the network path between user and application.
- Key use cases: SaaS availability validation, pre-migration baselining, SLA compliance, proactive issue detection, and troubleshooting degraded user experience across hybrid and multi-cloud environments.
Why is Digital Experience Monitoring Important?
Application developers are beginning to recognize DEM’s value to the end-user experience. Many DevOps teams are building in APIs early in the software development life cycle as part of the testing process of new releases. These APIs allow DEM systems to properly measure the performance of the end-user experience and the underlying application components. These more modern DEM solutions are especially sought after by infrastructure and operations leaders because they want to use DEM to regain insight into the performance of applications as they migrate to the cloud.
Network engineers also recognize the value of DEM. The performance of the network directly impacts the digital experience of application users. For this branch of DEM, synthetic traffic is generated to proactively measure network performance for packet loss, latency, and jitter.
Since DEM can measure the performance from the user’s point of view, the data collected can help uncover the impact that degraded performance can have on the business — everything from revenue generation to brand reputation and customer loyalty.
Advantages of Digital Experience Monitoring
One of the most significant advantages of DEM is the ability to improve the end-user experience. By monitoring end-user experience, organizations can quickly identify and address performance issues that impact customer experience and satisfaction. This can lead to better business outcomes, including increased revenue, customer retention, and brand reputation.
DEM also helps identify performance issues across digital processes. DEM solutions can monitor application performance and web security, enabling organizations to quickly identify and resolve problems impacting digital business initiatives. Additionally, DEM solutions can provide insights into the performance of third-party applications and services, allowing organizations to hold vendors and service providers accountable for their performance and availability.
Finally, DEM can help organizations create better business outcomes by providing a comprehensive view of network and application performance. By analyzing the data collected through DEM, organizations can identify trends and make data-driven decisions to improve the end-user experience, reduce costs, and increase customer satisfaction.
The Primary Components of Digital Experience Monitoring
DEM combines three primary technology components, each providing a different lens on user experience:
Synthetic Monitoring / Synthetic Transaction Monitoring (STM)
Synthetic monitoring uses agents to proactively test services such as SaaS applications like Salesforce and API endpoints. Unlike Real User Monitoring (described below), STM isn’t generally run against active users. Instead, its mission is usually to test the hosted or SaaS application (e.g., Salesforce, Office 365) before users encounter problems.
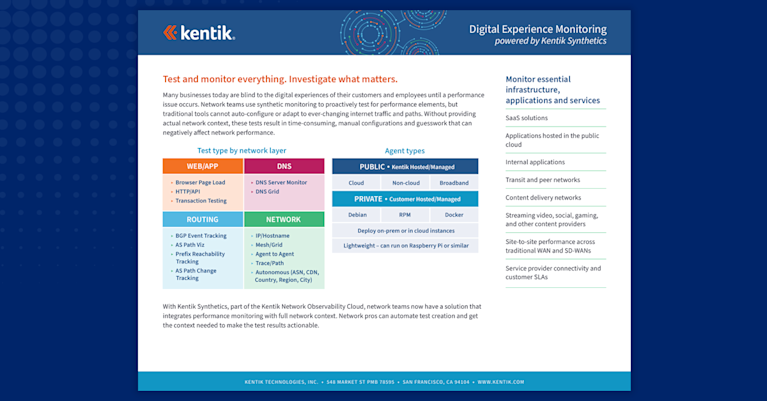
Synthetic monitoring techniques typically involve running a mix of HTTP commands (POST, GET, PUT, or DELETE) on a regular and periodic basis. Deeper testing can also cover connection times, DNS resolution, TLS handshake latency, and database query speeds. Depending on the solution, the frequency of testing can vary from daily to sub-one-minute intervals.
Synthetic monitoring can also be used to understand a website’s or web application’s performance in terms of specific user interactions with that site. This type of Digital Experience Monitoring is often termed “Synthetic Transaction Monitoring.” Learn more about these techniques in our Kentipedia article, “What is Synthetic Transaction Monitoring (STM)?”.
Metrics on response times, packet loss, jitter, and transaction times are gathered and sent to the DEM collection platform, where correlations are performed. With integrated DEM and NPMD (Network Performance Monitoring and Diagnostics), tests can be correlated across different forms of telemetry like NetFlow, sFlow, VPC logs, and SNMP counters.
Endpoint Monitoring
Endpoint Monitoring provides visibility into user devices and performance testing from the endpoint. This includes the version of the operating system, CPU and memory usage, storage space, and network metrics. While it can seem similar to desktop inventory software, the focus is on continued performance and availability rather than asset management.
Real User Monitoring
Real User Monitoring (RUM) monitors and measures the end-user experience when using the applications the business depends on — customer relationship management (e.g., Salesforce), collaboration tools (e.g., Slack, Microsoft Teams), and social media platforms (e.g., YouTube, Facebook). RUM uses application-based monitoring (usually JavaScript) or browser plugins to look at the actual performance that users are experiencing. Usually, this is available on a per-transaction basis and includes telemetry on bottlenecks that may be due to browser CPU or RAM overload.
Digital Experience Monitoring Use Cases
DEM and synthetic monitoring technologies can be applied to solve various application and network infrastructure problems, reduce costs, and improve visibility into performance. Key use cases include:
- Finding and fixing application or network issues before they impact users.
- Benchmarking and baselining the performance of applications, APIs, websites, and networks across different time-frames, geographies, and conditions.
- Holding vendors and service providers accountable by monitoring performance and availability versus SLAs (service level agreements).
- Preparing for significant network transitions, such as adding a new geographic market or moving a data center to the cloud.
- Ensuring the performance of your own service offerings adheres to customer SLAs, with regular reporting on performance versus those agreements.
Digital Experience Monitoring and Synthetic Monitoring Agents
Synthetic tests conducted by a DEM solution should be performed from multiple geographic locations to identify problems with specific network links and understand performance metrics for users in different regions.
Kentik has built out a global network of synthetic testing agents that customers use to verify performance levels of all major public or private cloud-based applications and SaaS applications. These agents are located inside Amazon Web Services, Google Cloud Platform, Microsoft Azure, Oracle Cloud Infrastructure (OCI), Alibaba Cloud, and IBM Cloud, as well as in data centers at key internet hubs worldwide. Customers can also deploy private agents in their own data centers, branch offices, and cloud VPCs.
Kentik’s State of the Internet feature extends this further by providing at-a-glance visibility into the health, performance, and availability of common SaaS applications, public cloud inter-region connectivity, and DNS services — at no additional test credit cost.
Challenges of Digital Experience Monitoring
Despite its benefits, several challenges are associated with implementing a DEM strategy. One of the biggest is the mix of technologies that DEM solutions rely on. To get a complete picture of digital experience, organizations need to pull data from synthetic monitoring, real-user monitoring, and endpoint monitoring — sometimes requiring a complex technology stack that can be challenging to manage.
Additionally, collecting data on user behavior across multiple devices, applications, and networks can be difficult without the right tools in place. Analyzing and interpreting that data requires expertise in multiple areas, including network performance monitoring, application performance monitoring, and web security.
Ideal DEM solutions address these challenges by providing a unified platform that integrates with existing technology stacks and delivers actionable insights. They should provide easy-to-use analytics that allow users to access the data they need to make informed decisions. Kentik’s approach unifies synthetic monitoring, flow-based traffic analysis, infrastructure metrics, and AI-driven insights in a single platform — so teams don’t need to stitch together data from multiple tools to understand the end-user experience.
Types of Digital Experience Monitoring (DEM) Tools
A wide range of DEM tools are available, each designed to address specific monitoring needs. When building a DEM strategy, organizations typically combine several of the following tool types:
Synthetic Monitoring Tools
Synthetic monitoring tools simulate user interactions with applications, websites, and APIs to proactively test their performance and availability. By creating synthetic transactions, these tools can identify potential bottlenecks before they impact real users. Synthetic monitoring tools are valuable for benchmarking performance across different regions, devices, or network conditions.

Real User Monitoring (RUM) Tools
Real User Monitoring tools collect data on actual user interactions with applications and services, providing insights into how real users experience the digital environment. RUM tools use JavaScript-based monitoring or browser plugins to track user behavior and gather performance metrics including page load times, transaction times, and user interactions. This category is sometimes called End User Experience Monitoring (EUEM).
Endpoint Monitoring Tools
Endpoint monitoring tools focus on the performance and availability of user devices — desktops, laptops, and mobile devices. These tools gather data on system performance including CPU and memory usage, storage capacity, and network connectivity to identify potential issues that may impact the end-user experience.
Application Performance Monitoring (APM) Tools
Application Performance Monitoring tools provide in-depth insights into the performance and health of applications and their underlying infrastructure. APM tools collect and analyze data on response times, error rates, and resource utilization. By integrating with DEM tools, APM solutions can offer a comprehensive view of the digital experience.
Network Performance Monitoring and Diagnostics (NPMD) Tools
NPMD tools focus on the performance and health of networks, analyzing data on network traffic, latency, packet loss, and other key performance indicators. NPMD tools are often used with other DEM tools — such as synthetic monitoring and RUM — to give a complete picture of the digital experience. Learn more in our article on Network Performance Monitoring.
When selecting Digital Experience Monitoring tools, it’s crucial to consider your unique needs, infrastructure, and goals. The most effective approach typically combines multiple tool types within a unified platform that can correlate data across all of them.
Evaluating Digital Experience Monitoring Tools for Your DEM Strategy
When evaluating potential DEM tools, IT operations teams should look for solutions that offer:
- End-to-end visibility across all applications, including web and mobile applications and endpoints.
- Real-time monitoring of user behavior and performance data to detect and troubleshoot issues as they occur.
- Both synthetic and real user monitoring — synthetic for proactive testing, RUM for insights into actual user behavior and experience.
- Analytics and reporting capabilities to help IT teams identify performance issues and optimize application and network performance.
- Seamless integration with existing IT infrastructure and tools, such as APM and DevOps monitoring solutions.
Related Kentipedia Articles
- What is Synthetic Monitoring?
- Synthetic Monitoring vs Real User Monitoring
- What is Synthetic Transaction Monitoring (STM)?
- What is End User Experience Monitoring?
- Network Performance Monitoring
- The Role of Network Observability in Modern APM
- What is NPMD?
FAQs about Digital Experience Monitoring
What is digital experience monitoring (DEM)?
Digital experience monitoring is a performance analysis discipline that measures the quality of end-user interactions with enterprise applications and services. It combines synthetic monitoring, real user monitoring, and endpoint monitoring to provide a complete picture of the user experience across cloud, hybrid, and on-premises environments.
What are the three main components of DEM?
The three primary components are synthetic monitoring (proactive scripted tests that simulate user interactions), real user monitoring or RUM (passive observation of actual user sessions), and endpoint monitoring (device-level health data like CPU, memory, and connectivity). Together, they provide both proactive detection and real-world validation of user experience.
What is the difference between DEM and APM?
Application Performance Monitoring (APM) focuses on the internal health of applications — code execution, database queries, server resources. Digital Experience Monitoring focuses on the end-to-end experience as the user sees it, including the network path between user and application. The two are complementary: APM tells you what’s wrong inside the application, while DEM tells you what the user is actually experiencing.
Why is DEM important for cloud migration?
As applications move from on-premises data centers to cloud and SaaS environments, traditional monitoring tools lose visibility because the infrastructure is no longer under direct control. DEM restores that visibility by measuring performance from the user’s perspective regardless of where the application is hosted. Kentik supports this by combining synthetic tests to cloud and SaaS endpoints with real traffic flow analysis, so teams can see whether cloud-hosted applications are meeting performance expectations.
How does synthetic monitoring fit into a DEM strategy?
Synthetic monitoring is the proactive component of DEM. It uses scripted tests — HTTP requests, DNS lookups, page loads, multi-step transaction scripts — run from globally distributed agents to detect performance issues before real users encounter them. It’s especially valuable for baselining performance, validating SLAs, and catching regressions during off-hours when real user traffic is low.
How can DEM help with SLA compliance?
DEM provides continuous, measurable data on application availability, response time, and network performance from multiple geographies — exactly the metrics most SLAs are built around. By monitoring these metrics proactively, teams can demonstrate compliance to customers and identify when a third-party provider or internal service is falling short. Kentik Synthetics supports this with configurable alerting thresholds and time-based health views in the Synthetics Dashboard.
What should I look for when evaluating DEM tools?
Look for end-to-end visibility across applications and networks, both synthetic and real user monitoring capabilities, real-time alerting, integration with your existing infrastructure and DevOps tools, and the ability to correlate performance data across different data sources. The most effective DEM platforms unify these capabilities in a single view rather than requiring separate tools for each.
How does Kentik approach digital experience monitoring?
Kentik combines synthetic monitoring, flow-based traffic analytics, infrastructure metrics, and AI-driven insights in a single network intelligence platform. Kentik Synthetics runs continuous tests from hundreds of global agents across AWS, GCP, Azure, OCI, and key internet hubs, while real traffic data provides the context to determine whether test failures are affecting actual users. AI Advisor helps teams investigate performance issues using natural language.
Monitor and optimize digital experience with Kentik
Kentik is the network intelligence platform that unifies synthetic monitoring with real traffic analytics — so you can measure the digital experience, understand what’s driving degradation, and fix it before users are affected.
- Get a demo — See how Kentik monitors digital experience across hybrid and multi-cloud environments
- Kentik Synthetics — Proactive testing with ping, traceroute, HTTP, DNS, page load, and transaction tests
- Kentik Global Synthetic Network — Hundreds of agents across AWS, GCP, Azure, OCI, and key internet hubs worldwide
- Digital Experience Monitoring Solutions — DEM powered by unified synthetic and real traffic data
- Kentik AI Advisor — Investigate performance issues and troubleshoot degraded user experience with natural language


